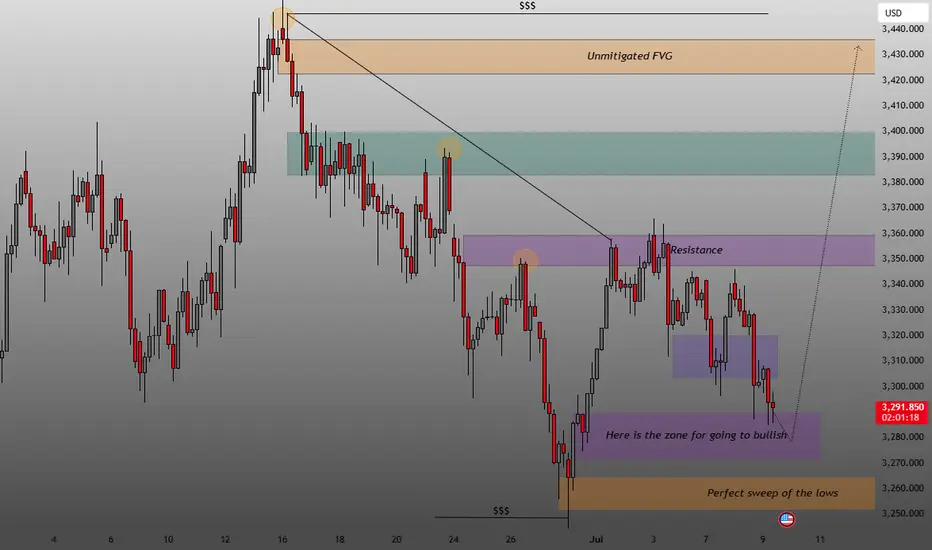
Smart Money Concepts (SMC) and Fair Value Gaps (FVGs). Here's a detailed breakdown of the chart:
🟠 Top Zone:
Label: "Unmitigated FVG"
This is a Fair Value Gap zone around 3430–3440 USD that hasn't been mitigated (price hasn’t returned to fill this imbalance).
It indicates a potential future liquidity target or supply zone where price may reverse.
🟣 Mid Zone (Resistance):
Label: "Resistance"
This area has been marked as a resistance level, where price previously failed to break above.
Likely represents institutional selling interest.
🟢 FVG Area Below Resistance:
A Fair Value Gap zone below resistance, partially filled earlier.
May act as a supply zone again if price returns.
🟣 Lower Purple Zone:
Label: "Here is the zone for going to bullish"
This is a demand zone where the analyst expects a potential bullish reversal.
Indicates an area of interest for buying opportunities based on price reaction.
🟠 Bottom Zone:
Label: "Perfect Sweep of the Lows"
Indicates a liquidity sweep or stop hunt, where price cleared previous lows.
This could mean smart money accumulation before a bullish move.
🔻 Trendline:
A downward trendline drawn from the recent high to current levels.
Shows a bearish market structure, but price may be near a reversal point if it breaks this line upward.
💡 Summary:
The chart suggests a potential bullish reversal setup after a liquidity sweep at the bottom.
Key confluences include: swept lows, unmitigated FVGs, demand zone, and resistance above acting as a future target.
Disclaimer
The information and publications are not meant to be, and do not constitute, financial, investment, trading, or other types of advice or recommendations supplied or endorsed by TradingView. Read more in the Terms of Use.
Disclaimer
The information and publications are not meant to be, and do not constitute, financial, investment, trading, or other types of advice or recommendations supplied or endorsed by TradingView. Read more in the Terms of Use.