📌 Core market logic: Risk aversion dominates, gold fluctuates at high levels
Geopolitical risks surge
Middle East situation: Israel launches large-scale ground operations in Gaza, and the conflict escalates.
Russia-Ukraine war: Russia launches the largest air strike since 2022, and negotiations break down.
Iran nuclear issue: Iran's tough statement of "never stopping uranium enrichment" has aggravated market concerns.
Financial system turmoil
Moody's downgrades US rating: Market concerns about the credit of the US dollar have increased, and gold has become more attractive as an alternative asset.
Global trade war risk: As uncertainty increases, demand for gold hedging rises.
Economic data is light
There is a lack of heavy data this week, and the market focus is still on geopolitics and risk aversion.
📊 Technical key signals
1. Daily level: Stand firm on the 60-day moving average, bulls dominate
Last week, the long shadow of the middle Yin line was closed, showing strong support at 3200.
Monday's gap-up opening broke through short-term resistance, but there is still pressure in the 3250-3260 area.
Bollinger Bands closed, if it stands firmly on the middle track (near 3280), it may open up to 3350-3400.
2. 4-hour level: strong shock, pay attention to key breakthroughs
Bottoming out + gap-up opening, short-term bulls dominate, but it is still a volatile market before 3280 is broken.
Support below 3200-3210 (key retracement long area).
Resistance above 3250-3260 (if it breaks through, it will test 3280, and the rise may accelerate after breaking).
🎯 Today's trading strategy
📌 Short-term operation ideas: low-long mainly, high-short as auxiliary
✅ Long opportunity (main strategy)
Entry point: 3200-3210 (retracement to support zone)
Target: 3250 → 3265 → 3280
Stop loss: below 3190 (to prevent false breakthrough)
⚠ Short opportunity (secondary strategy, operate with caution)
Entry point: 3250-3260 (short before breaking)
Target: 3220 → 3200
Stop loss: above 3270 (to prevent unilateral rise after breaking)
📌 Medium and long-term layout
If it breaks through 3280 → you can chase long, target 3350-3400.
If it falls back to 3200 without breaking → it can be regarded as a second opportunity to arrange long orders.
⚠ Risk Warning
Geopolitical changes (such as ceasefire agreements, cooling of the situation) may cause a rapid correction in gold.
Dollar trend (if the Fed releases hawkish signals, it may suppress gold).
Technical key position (whether 3280 is broken or not determines the subsequent trend).
📢 Conclusion: Gold is supported by safe-haven in the short term, but we need to be wary of high-level fluctuations. It is recommended to mainly go long on lows and strictly stop losses!
Trade active
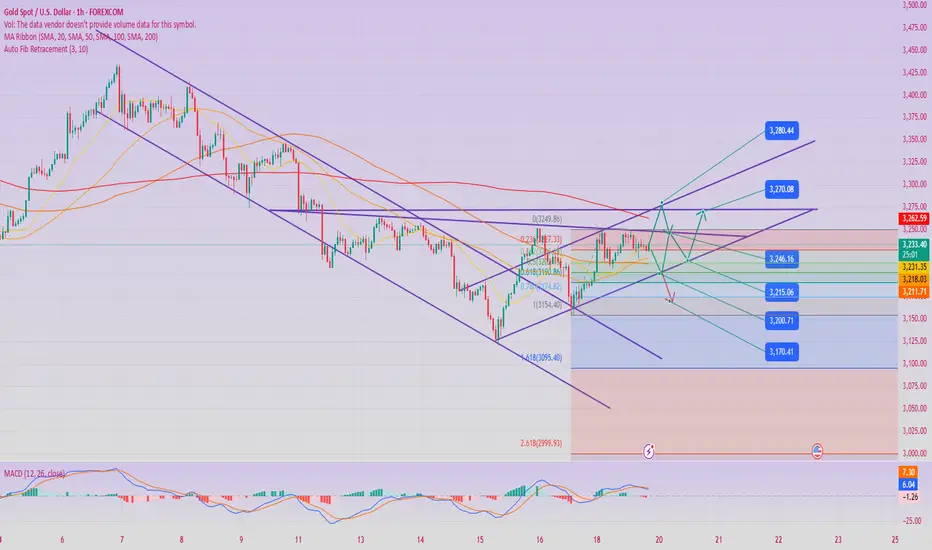
Gold is still in a rebound at the daily level, and continues to wait for the opportunity to test the upper track of the channel. However, this time the pull-up is relatively slow, and it is trapped in a small range of sideways trading within the range. Through sideways trading, the downward momentum of MACD can be continuously digested. When it touches below the zero axis, the market will brew upward momentum and usher in a new round of unilateral pull-up trend. The short-term resistance is still to pay attention to the 10-day moving average and the middle track. Only when they can all break through and stand on them can there be hope to test the upper track of the channel; otherwise, it will continue to fluctuate.
Gold 4-hour level stepped back on Tuesday to confirm that the middle track was supported. The short-term resistance is 3290. Only when the big sun breaks through and stands on it effectively can it impact the next segmentation pressure of 3300. The hourly level has been consolidating around 3250-3200 in the past few days. On Monday, it attacked 3250 several times without success and finally fell back to shock. On Tuesday, it tested 3200 downwards, stabilized and then shocked and attacked again. The US market broke through 3250 in one fell swoop, and today it is the middle track 3225 support; it tends to step back and accumulate strength before shocking and attacking. Therefore, it is recommended to pay attention to the support of 3225-3220 in the short term, and the lowest key support of 3200 to try to be bullish in the band. If it breaks through the pressure of 3290 again, this small range of shocks can be ended, opening up further room for pull-up. On the whole, today's short-term gold operation strategy is recommended to focus on long positions on pullbacks, supplemented by shorting on rebound highs. In the short term, pay attention to the 3300-3310 resistance on the upper side and the 3260-3250 support on the lower side.
Trade closed: target reached
[Core trading logic]
Daily level triangle convergence
The price forms a symmetrical triangle at 3180-3320, and is currently in the final consolidation (a direction must be determined within 3-5 trading days)
MACD key signal: The fast and slow lines are glued below the zero axis. If a golden cross appears, it will confirm the daily level rebound
Volume observation: The recent decline has shrunk significantly, which is in line with the characteristics of "main force accumulation"
4-hour cycle order flow analysis
Institutional cost area: 3220-3230 (the largest trading volume area in the past 2 weeks)
Key pressure levels:
First pressure 3285 (20EMA+Fibonacci 38.2%)
Core pressure 3308 (previous high neckline + channel upper rail)
Breakthrough validity standard: 2 consecutive 4-hour K-lines close firmly at 3300, and the trading volume ≥ 120% of the daily average volume
1-hour chart short-term rhythm
Asian market rules: There have been 5 times in the past 7 days 3250-3270 forms the intraday high and low points
European market momentum: If it breaks through 3275, the success rate of long positions before the US market will reach 68%
[Today's practical strategy]
Scenario 1: Oscillating upward (probability 65%)
Bull entry point:
Conservative: Go long after stepping back to 3248-3253 (15-minute Bollinger lower track), stop loss 3238, target 3275→3290
Aggressive: After breaking through 3278, step back to 3268 to chase long positions, stop loss 3258, target 3300
Key verification:
If 3280 is not broken before the US market, reduce the position by 50% to lock in profits
Scenario 2: False breakthrough reversal (probability =25% probability)
Short opportunities:
Place short orders when the price reaches 3305-3310 for the first time (stop loss 3318), target 3280→3260
If the price shows "long upper shadow + MACD top divergence" near 3290, enter the market with a short order immediately
Stop loss discipline:
All short order stop losses must be set above 3320
Scenario 3: Black swan decline (probability 10%)
Emergency plan:
After falling below 3230, short at 3245, stop loss 3260, target 3200→3180
If it reaches 3180 (the lower track of the daily line), close the short position and reverse the layout of the mid-line long position
Related publications
Disclaimer
The information and publications are not meant to be, and do not constitute, financial, investment, trading, or other types of advice or recommendations supplied or endorsed by TradingView. Read more in the Terms of Use.
Related publications
Disclaimer
The information and publications are not meant to be, and do not constitute, financial, investment, trading, or other types of advice or recommendations supplied or endorsed by TradingView. Read more in the Terms of Use.