As geopolitical and economic tensions are slowly settling down, the price of gold eased its road toward the higher grounds. During the previous week, gold was traded with a bearish sentiment, dropping from the level of $3.395 down to $3.262. The main causes behind the drop in the price of gold are related to decreased tensions in the Middle East, as well as, settlement of the trade tariffs deal between the U.S. and China. Although the details of this deal was not disclosed publicly, still, the market reacted positively to the news. Investors moved funds from safe-haven assets toward the equity and the crypto market, as riskier ones in a quest for higher returns.
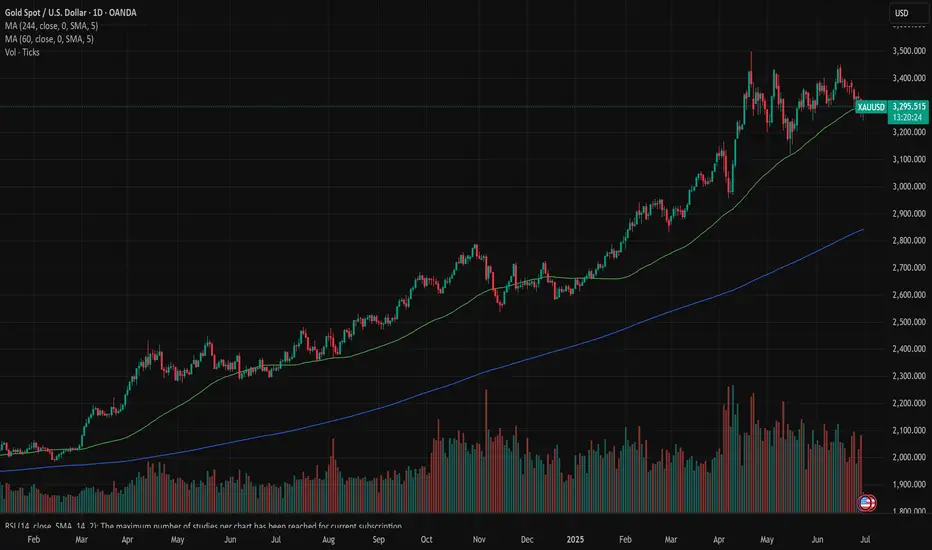
The RSI took the down path, ending the week at the level of 41. The indicator is currently clearly on the road toward the oversold market side. The price of gold breached the MA50 line during the previous week, which was acting like a support line for the price of gold during the previous period. The MA200 continued with an uptrend, following the MA 50 line. There is a high distance between two lines, so the potential cross is still not in the store for the price of gold.
Charts are pointing that the gold is on the easing road currently, with a potential for further correction in the coming period. The RSI is indicating that the oversold market side might be reached in the coming period, which means that the price could further ease. The bottom of the current correction might be $3.180, which was the highest level in mid April this year. Still, some short reversals are quite expected on this road, in which sense, Monday might start with a short attempt for higher grounds. In this sense, the $3,3K level might be tested.
Related publications
Disclaimer
The information and publications are not meant to be, and do not constitute, financial, investment, trading, or other types of advice or recommendations supplied or endorsed by TradingView. Read more in the Terms of Use.
Related publications
Disclaimer
The information and publications are not meant to be, and do not constitute, financial, investment, trading, or other types of advice or recommendations supplied or endorsed by TradingView. Read more in the Terms of Use.