ETH / BTC
Hi guys
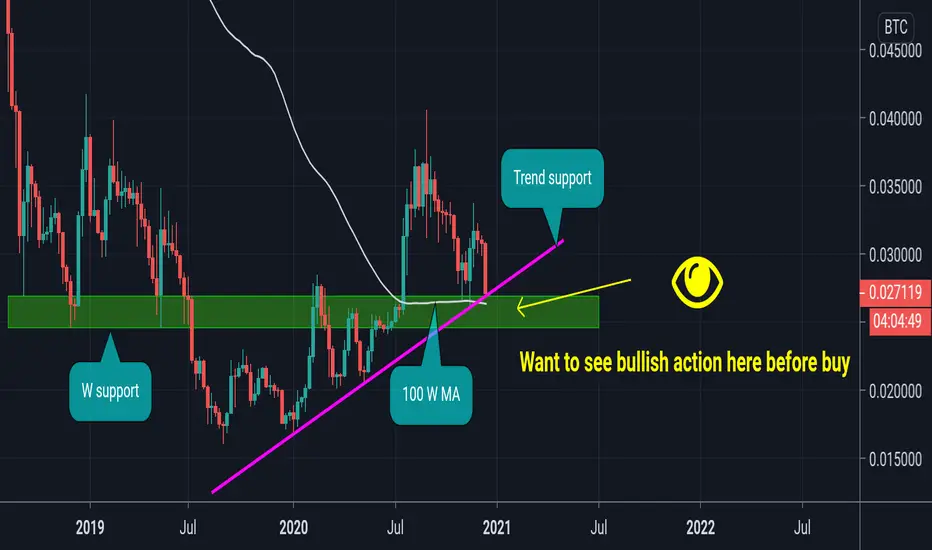
What can we see on weekly chart :
1- Eth dropped to weekly support area
2- trendline support (violet color)
3- we can see W MA ( dynamic support ) in area
We want to see bullish action here specially on smaller time frames before buying
Good luck and happy trading 🌹
Hi guys
What can we see on weekly chart :
1- Eth dropped to weekly support area
2- trendline support (violet color)
3- we can see W MA ( dynamic support ) in area
We want to see bullish action here specially on smaller time frames before buying
Good luck and happy trading 🌹
📈Telegram channel: t.me/bitcoin_masters
💎For Premium Signals Group ask me here: t.me/Babenski
💎For Premium Signals Group ask me here: t.me/Babenski
Related publications
Disclaimer
The information and publications are not meant to be, and do not constitute, financial, investment, trading, or other types of advice or recommendations supplied or endorsed by TradingView. Read more in the Terms of Use.