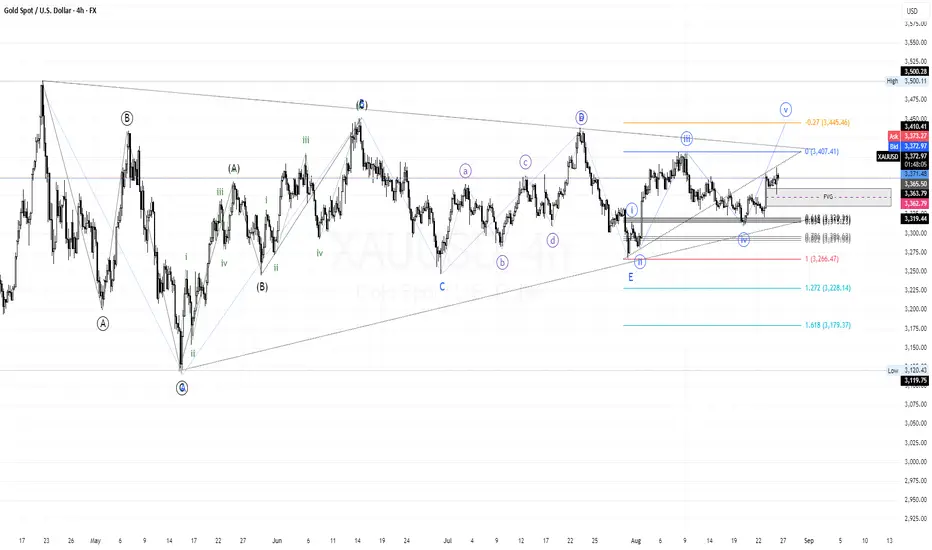
1. Elliott Wave Structure
From the chart, several patterns have already been mapped:
A larger A-B-C pattern on the left side.
Then it developed into an ABCDE (triangle) structure.
After that, it started forming an impulsive wave (i–v).
Currently, price action appears to be in Wave V of the upward impulse.
2. Key Levels (Fibonacci & Targets)
Wave V Targets:
Fibo -0.27 around 3445–3450 as the main resistance.
Fibo 1.0 extension (Wave III → IV) also points to the 3407–3410 zone.
Nearest Support:
3363–3368 (FVG + minor support).
If this level breaks, price may head toward 3266 (100% retrace from the previous structure).
Major Supports:
3228 (1.272) and 3179 (1.618).
3. Scenarios
📈 Bullish Case (primary)
As long as price holds above 3360–3365, there is a strong chance to extend higher toward 3407 and potentially 3445–3450.
This would likely complete Wave V before a possible deeper correction.
📉 Bearish Case (alternative)
If 3360 breaks and a strong candle closes below it → price could drop to 3266, then to 3228, and even 3180.
This would suggest Wave V has failed (truncated) and a larger correction has begun.
4. Trading Plan
Buy-on-dip area: 3365–3370 (with SL below 3355).
Main targets: 3407 → 3445.
If support breaks (close below 3360), cut loss → wait to buy in the 3266–3228 zone.
Disclaimer
The information and publications are not meant to be, and do not constitute, financial, investment, trading, or other types of advice or recommendations supplied or endorsed by TradingView. Read more in the Terms of Use.
Disclaimer
The information and publications are not meant to be, and do not constitute, financial, investment, trading, or other types of advice or recommendations supplied or endorsed by TradingView. Read more in the Terms of Use.
