Gold technical analysis
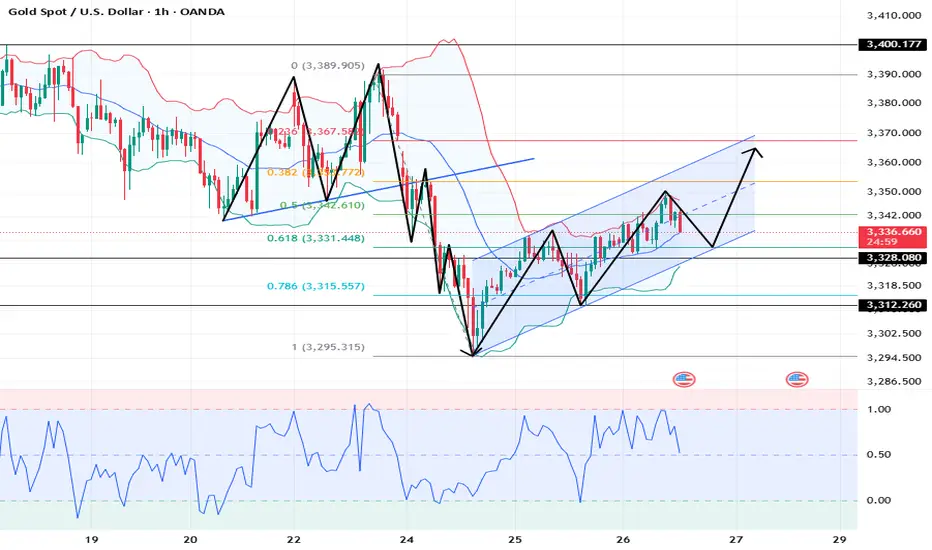
Daily chart resistance 3400, support 3295
4-hour chart resistance 3370, support 3312
1-hour chart resistance 3350, support 3328
The gold market has recently shown strong resistance to decline, showing signs of stopping the decline and stabilizing for two consecutive trading days. The low point of the hourly chart is gradually moving up. This positive signal further consolidates the support of the market bottom. Today's opening price is around 3330, and the highest point of the oscillation upward is 3350. The recent volatility has decreased. In the NY market, we will focus on today's opening price of 3330 as the dividing line between long and short. If it falls below this position, the lowest target can be seen near 3312. Before that, you can do scalp buying transactions above 3330.
Buy: 3330near
Buy: 3312near
Note
Tip: The second time it reaches 3330near. Is it an opportunity? Today, repeatedly buying and scalping near 3330 is the only opinion!Trade active
If it falls below 3330, it will fall to 3312, and then it will start to rise at 3312. Perfect prediction! Now it has returned to around 3330 from 3310Note
As I analyzed, it is suppressed by 3330. After breaking through, change the strategy and sell to 3312, which is the first target.📉. The trend is changing, my analysis will make you profitable if you buy or sell today💥Telegram Channel Free Updates 👉🏻
💥t.me/Actuary00group
✉️Gold Signal and daily analysis channel
💥t.me/Actuary00group
✉️Gold Signal and daily analysis channel
Disclaimer
The information and publications are not meant to be, and do not constitute, financial, investment, trading, or other types of advice or recommendations supplied or endorsed by TradingView. Read more in the Terms of Use.
💥Telegram Channel Free Updates 👉🏻
💥t.me/Actuary00group
✉️Gold Signal and daily analysis channel
💥t.me/Actuary00group
✉️Gold Signal and daily analysis channel
Disclaimer
The information and publications are not meant to be, and do not constitute, financial, investment, trading, or other types of advice or recommendations supplied or endorsed by TradingView. Read more in the Terms of Use.