Dear Trader,
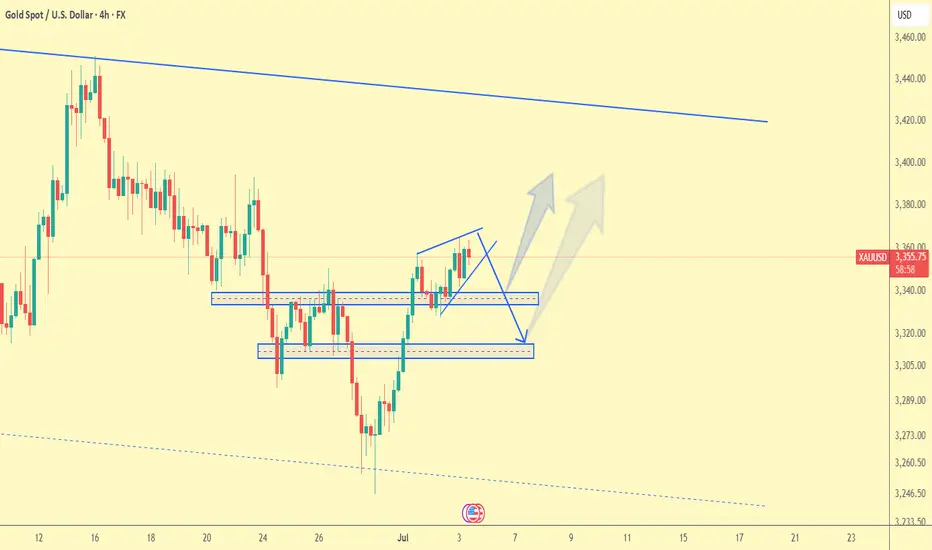
On the 4H chart of XAU/USD, a rising wedge pattern is forming, which is typically a bearish reversal signal. After a significant upward movement, price is currently testing the 3360–3365 resistance area. If the lower boundary of the wedge breaks, the price is likely to drop toward the key support zones:
First support zone: 3330–3340
Second support zone: 3305–3315
If buyers defend these areas, a rebound to the upside may occur. But if the second support also breaks, deeper bearish pressure is likely.
Scenarios:
Bullish: If the price holds above 3365, it may rally toward 3380–3400 resistance.
Bearish: A breakdown from the wedge and loss of 3330 support could trigger a move down to 3310 or lower.
Regards,
Alireza!
💰MY FREE FOREX CRYPTO SIGNALS TELEGRAM CHANNEL: : t.me/Alirezaktrade
Disclaimer
The information and publications are not meant to be, and do not constitute, financial, investment, trading, or other types of advice or recommendations supplied or endorsed by TradingView. Read more in the Terms of Use.