📌 XAUUSD – Bullish Flag Pattern on the Hourly Chart
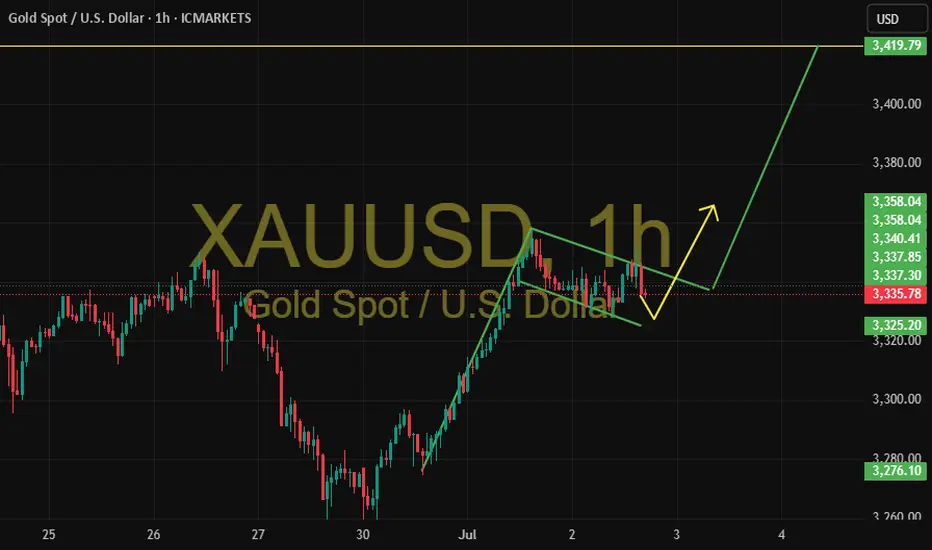
Gold completed a strong upward move last week and then entered a corrective phase forming a classic bullish flag pattern with a descending channel.
🟡 Currently, price is consolidating within the pattern boundaries. As long as it holds the support area around 3,325, the favored scenario is a continuation of the bullish trend upon an upward breakout.
🎯 Technical target after breakout: 3,419, based on the flagpole height.
📉 In case of a downside break, the scenario will be reassessed.
🔍 This analysis is for educational purposes only and not a trading recommendation.
Disclaimer
The information and publications are not meant to be, and do not constitute, financial, investment, trading, or other types of advice or recommendations supplied or endorsed by TradingView. Read more in the Terms of Use.
Disclaimer
The information and publications are not meant to be, and do not constitute, financial, investment, trading, or other types of advice or recommendations supplied or endorsed by TradingView. Read more in the Terms of Use.