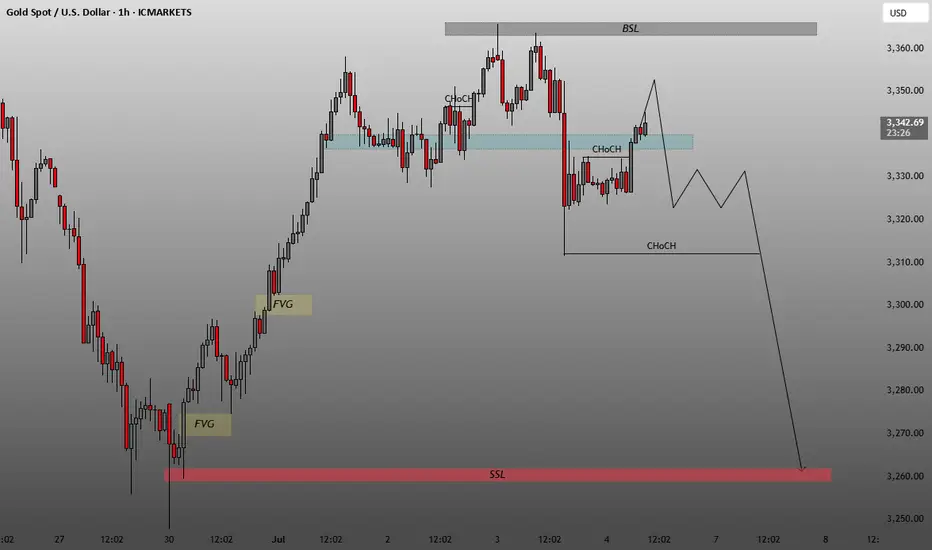
BSL (Buy-Side Liquidity):
Marked near $3,360 at the top (gray zone).
Represents an area where buy stops may be resting above recent highs.
SSL (Sell-Side Liquidity):
Marked around $3,260 at the bottom (red zone).
Indicates the target for potential bearish liquidity grab.
FVG (Fair Value Gap):
Highlighted in yellow near $3,270–$3,280.
Unfilled imbalance that may attract price.
ChoCH (Change of Character):
Two ChoCH labels are marked:
One minor bullish ChoCH around the $3,328 area indicating a short-term shift in structure.
One bearish ChoCH below $3,310, suggesting a possible return to bearish bias if broken.
Blue Supply Zone:
An area of previous supply or resistance where price may reverse.
📉
Projected Price Path:
Initial move up into the blue supply zone, possibly to induce buyers or sweep short-term highs.
Followed by a strong bearish rejection, breaking below the lower ChoCH level (~$3,310).
A drop is anticipated all the way to the SSL zone (~$3,260), possibly filling the FVG on the way.
🧠 Summary:
This chart implies a smart money bearish setup:
Short-term liquidity sweep to the upside.
Break of structure (ChoCH) to confirm reversal.
Bearish continuation targeting:
Fair Value Gap (FVG) → ~$3,270s
Sell-Side Liquidity (SSL) → ~$3,260
Disclaimer
The information and publications are not meant to be, and do not constitute, financial, investment, trading, or other types of advice or recommendations supplied or endorsed by TradingView. Read more in the Terms of Use.
Disclaimer
The information and publications are not meant to be, and do not constitute, financial, investment, trading, or other types of advice or recommendations supplied or endorsed by TradingView. Read more in the Terms of Use.