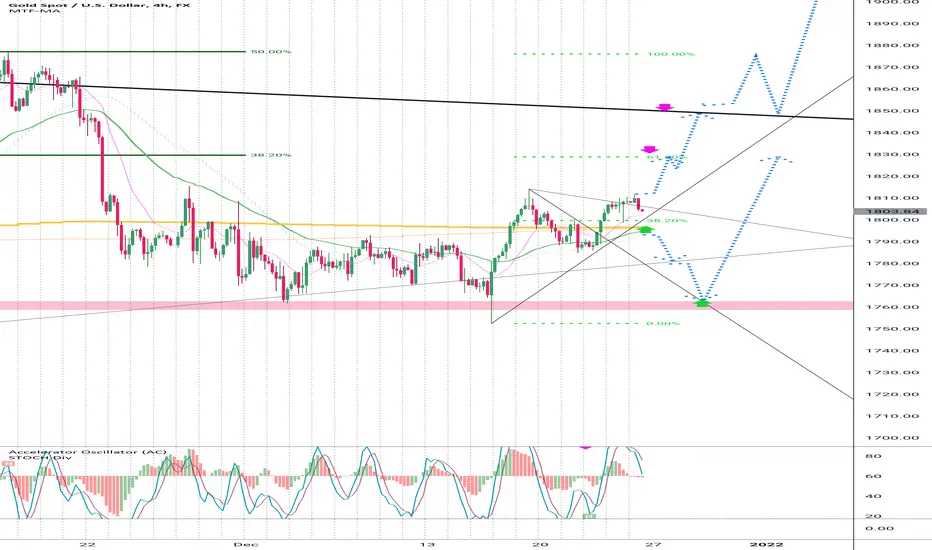
gold has 2 scenario (daily chart trend will +)
1- break high and go to fibo 61% (it is in way to fibo 161% near 1920)
2- go down and create butterfly pattern then fly up to fibo 61% 1830
alert= 100% put SL , gold if break low , can crash to 1500$ (fibo 61% on weekly chart)
if low 1750 break=sell signal ,,we can looking for sell
in red arrow we can sell but 100% put sl and trailstop near 8.00(on gold you can wait pinbar (15-60-240-1440 min chart)then pick sell with sl on high)
note= AC daily is red
Disclaimer
The information and publications are not meant to be, and do not constitute, financial, investment, trading, or other types of advice or recommendations supplied or endorsed by TradingView. Read more in the Terms of Use.
Disclaimer
The information and publications are not meant to be, and do not constitute, financial, investment, trading, or other types of advice or recommendations supplied or endorsed by TradingView. Read more in the Terms of Use.