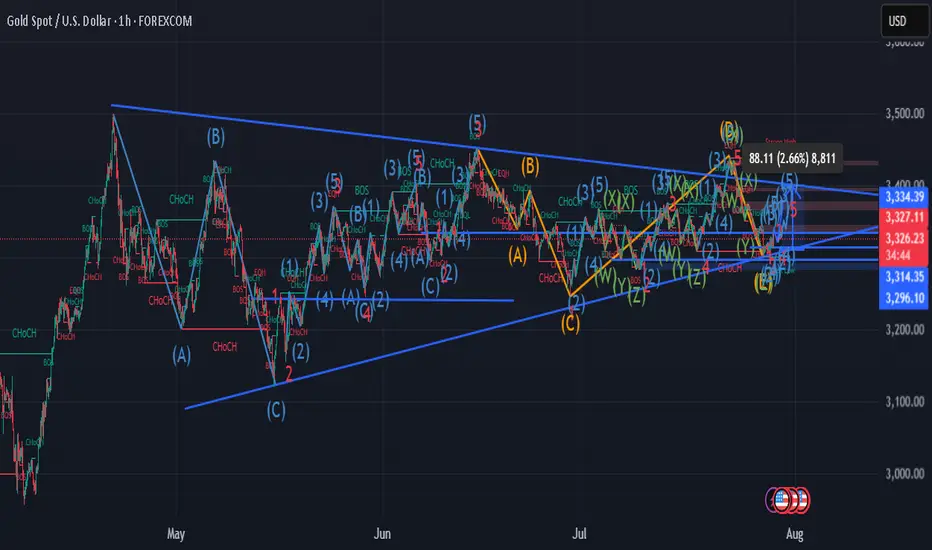
This chart highlights a large symmetrical triangle formation, with an internal WXYXZ corrective structure blended with impulsive Elliott Waves (1)-(5). The price action is marked by key structural shifts: CHoCH, BOS, and EOH, signaling trend reversals and liquidity grabs.
📌 Price recently bounced off the ascending trendline, forming a potential wave (2) low, suggesting a bullish move into a wave (3) impulse.
🔼 Short-term target points to a revisit of the strong resistance zone around 3,400–3,410.
📊 Key Setup:
• Pattern: Symmetrical Triangle
• Wave Count: Corrective WXYXZ + impulsive structure in progress
• Signals: Bullish CHoCH + BOS confirmation
🎯 Trade Idea:
• ✅ Direction: BUY
• 🎯 Take Profit (TP): 3,400 – 3,410
• 🔻 Stop Loss (SL): 3,296
🔁 Sideways range compression sets up ideal conditions for short-term swing or breakout scalps.
Disclaimer
The information and publications are not meant to be, and do not constitute, financial, investment, trading, or other types of advice or recommendations supplied or endorsed by TradingView. Read more in the Terms of Use.
Disclaimer
The information and publications are not meant to be, and do not constitute, financial, investment, trading, or other types of advice or recommendations supplied or endorsed by TradingView. Read more in the Terms of Use.