On the H1 timeframe, gold (XAUUSD) is showing signs of recovery after the recent sharp decline. Let’s break down the key technical factors:
1. Price Action & Trend
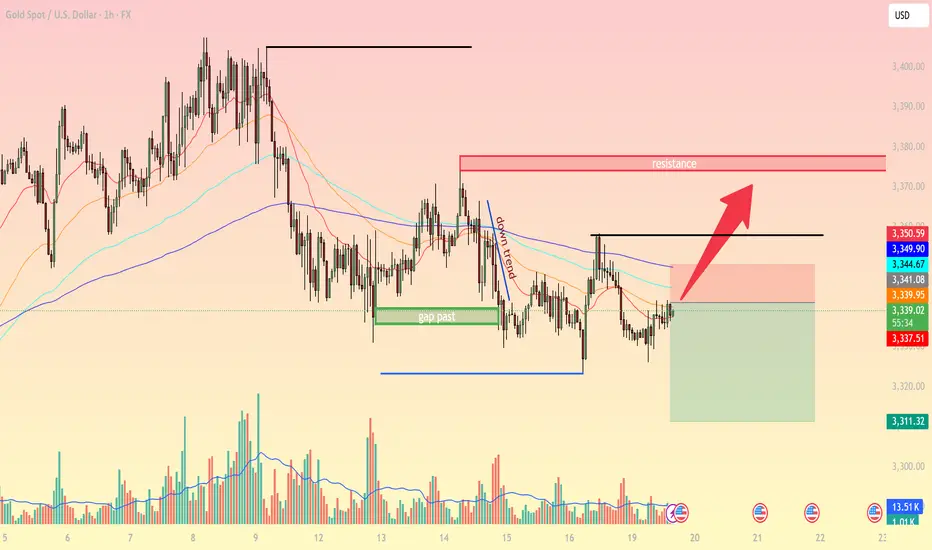
After a strong selloff and gap fill, price bounced from the 3311 support area.
Currently, XAUUSD is testing the confluence zone of short-term EMAs (20–50–100), which will determine whether the bullish momentum can extend.
Market structure suggests a potential corrective rally toward resistance.

2. Key Technical Levels
Immediate Support: 3330 – 3335 (EMA20 + local consolidation).
Major Support: 3311 (recent swing low + Fibonacci extension).
Near-term Resistance: 3349 – 3350 (EMA100 + recent rebound high).
Strong Resistance: 3375 – 3380 (supply zone + structural resistance).
3. Indicators
EMA: Price is attempting to reclaim EMA20/50; holding above 3340 could trigger further upside.
RSI (H1): Recovering from oversold territory, signaling bullish momentum.
Volume: Strong buying volume appeared at the recent low – an early sign of buyers stepping back in.
4. Trading Strategies
Scenario 1 (Short-term Long Setup):
Entry: 3335 – 3340 (if price sustains above EMA20).
TP1: 3350
TP2: 3375 – 3380
SL: below 3325
Scenario 2 (Sell from Resistance):
If price reaches 3375 – 3380 and forms bearish rejection signals, consider short entries.
TP: 3340 – 3330
SL: above 3385
5. Conclusion
Gold is currently in a corrective recovery phase. While the broader trend remains bearish, a rebound toward 3350 – 3380 is highly possible before the next directional move. This resistance zone will be critical for the next trading decisions.
Follow for more high-probability setups and detailed multi-timeframe strategies.
1. Price Action & Trend
After a strong selloff and gap fill, price bounced from the 3311 support area.
Currently, XAUUSD is testing the confluence zone of short-term EMAs (20–50–100), which will determine whether the bullish momentum can extend.
Market structure suggests a potential corrective rally toward resistance.
2. Key Technical Levels
Immediate Support: 3330 – 3335 (EMA20 + local consolidation).
Major Support: 3311 (recent swing low + Fibonacci extension).
Near-term Resistance: 3349 – 3350 (EMA100 + recent rebound high).
Strong Resistance: 3375 – 3380 (supply zone + structural resistance).
3. Indicators
EMA: Price is attempting to reclaim EMA20/50; holding above 3340 could trigger further upside.
RSI (H1): Recovering from oversold territory, signaling bullish momentum.
Volume: Strong buying volume appeared at the recent low – an early sign of buyers stepping back in.
4. Trading Strategies
Scenario 1 (Short-term Long Setup):
Entry: 3335 – 3340 (if price sustains above EMA20).
TP1: 3350
TP2: 3375 – 3380
SL: below 3325
Scenario 2 (Sell from Resistance):
If price reaches 3375 – 3380 and forms bearish rejection signals, consider short entries.
TP: 3340 – 3330
SL: above 3385
5. Conclusion
Gold is currently in a corrective recovery phase. While the broader trend remains bearish, a rebound toward 3350 – 3380 is highly possible before the next directional move. This resistance zone will be critical for the next trading decisions.
Follow for more high-probability setups and detailed multi-timeframe strategies.
🪙 JOIN OUR FREE TELEGRAM GROUP 🪙
t.me/dnaprofits
Join the community group to get support and share knowledge!
️🥇 Exchange and learn market knowledge
️🥇 Support free trading signals
t.me/dnaprofits
Join the community group to get support and share knowledge!
️🥇 Exchange and learn market knowledge
️🥇 Support free trading signals
Related publications
Disclaimer
The information and publications are not meant to be, and do not constitute, financial, investment, trading, or other types of advice or recommendations supplied or endorsed by TradingView. Read more in the Terms of Use.