Market news:
In the early Asian session on Monday (March 24), spot gold fluctuated in a narrow range and is currently trading around $3,022 per ounce. The international gold price fell 0.7% last Friday due to the strengthening of the US dollar and profit-taking. It once hit the 3,000 integer mark during the session. However, geopolitical and economic uncertainties linger, coupled with the expectation of a rate cut by the Federal Reserve, London gold prices are still supported by bargain hunting and safe-haven buying, and the weekly line has risen for the third consecutive week. In terms of geopolitical situation, Israel announced last week that it would launch sea, land and air attacks on Hamas in Gaza to force the other side to release the remaining hostages. This move means that Israel has abandoned the two-month ceasefire agreement and launched a full-scale air and ground offensive against Palestinian militant organizations. Traditionally, investment in the gold market is regarded as a safe investment in times of geopolitical and economic uncertainty, and usually performs strongly in a low-interest rate environment. This year, international gold has set 16 new record highs, reaching an all-time high of $3,057 per ounce. Although the gold market may face correction pressure in the short term, the long-term upward trend of gold has not changed. Factors such as global economic and political uncertainty, the Federal Reserve's monetary policy and geopolitical risks will continue to be the main driving force supporting gold prices. The PMI data of European and American countries in March will be released on this trading day, and investors need to pay close attention.
Technical Review:
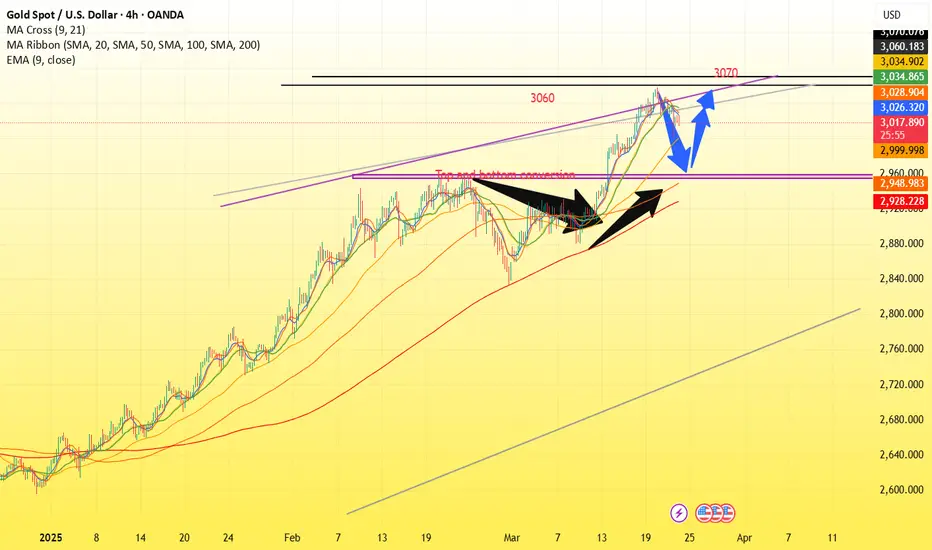
The gold daily line fell and rebounded on Friday. After a sharp retracement of the 3000 mark, the gold price closed above 3020. The daily closing price was still above the MA10/7-day moving average. The RSI indicator was running at a high value of 70. As of now, the MA10/7-day moving average still remains open upward at 3023/3000 respectively! In the short-term four-hour chart, the gold price is in the middle and lower track of the Bollinger Band. The MA10/7-day moving average opens downward and currently suppresses 3028 and the middle track of the Bollinger Band at 3032. The RSI indicator returns to the middle axis 50 value for sorting. The hourly chart RSI indicator runs below the middle axis and the moving average is glued together, and the price is in the middle track of the Bollinger Band. It is expected that the trading at the beginning of the week will maintain a large range of consolidation!
Today's analysis:
From the large-scale weekly chart, the long-term bullish trend of gold remains unchanged. After the previous big negative correction, it has risen for three consecutive weeks. The bulls are stable. Last week, the overall market rose and fell. The price stabilized at 2982 at the beginning of the week and soared all the way to 3057 and fell back. The closing price was near 3023. The weekly K closed with a small positive line with an upper shadow. The short-term bullish structure remains unchanged, but it is necessary to pay attention to the short-term correction pressure brought by the upper shadow line to correct the short-term moving average indicator. The current 5-week moving average is near 2941 and the 10-week moving average is at 2872. The correction is completed and the bullish trend remains unchanged. After the market rose to the 3057 line, the bulls took profits. The market ran a downward trend, and the price touched the 2999 line at the lowest. The current decline is just a correction to the previous rise. After the correction, it continues to be bullish. Last Friday night, the market fell sharply and then bottomed out and rebounded, and the K line rebounded! As for whether the correction is over, from the perspective of form, this wave of falling K-line is running a double positive correction with consecutive negative declines, and then we need to pay attention to whether the market will rebound with three consecutive positives to restart the upward trend, or turn negative and continue to fall. Considering that the current technical side is biased towards selling, the short-term operation is mainly based on selling at high prices below 3038, supplemented by buying at low prices.
Operation ideas:
Buy short-term gold at 3000-3003, stop loss at 2992, target at 3020-3030;
Sell short-term gold at 3037-3040, stop loss at 3048, target at 3010-3000;
Key points:
First support level: 3013, second support level: 3005, third support level: 2992
First resistance level: 3030, second resistance level: 3035, third resistance level: 3046
In the early Asian session on Monday (March 24), spot gold fluctuated in a narrow range and is currently trading around $3,022 per ounce. The international gold price fell 0.7% last Friday due to the strengthening of the US dollar and profit-taking. It once hit the 3,000 integer mark during the session. However, geopolitical and economic uncertainties linger, coupled with the expectation of a rate cut by the Federal Reserve, London gold prices are still supported by bargain hunting and safe-haven buying, and the weekly line has risen for the third consecutive week. In terms of geopolitical situation, Israel announced last week that it would launch sea, land and air attacks on Hamas in Gaza to force the other side to release the remaining hostages. This move means that Israel has abandoned the two-month ceasefire agreement and launched a full-scale air and ground offensive against Palestinian militant organizations. Traditionally, investment in the gold market is regarded as a safe investment in times of geopolitical and economic uncertainty, and usually performs strongly in a low-interest rate environment. This year, international gold has set 16 new record highs, reaching an all-time high of $3,057 per ounce. Although the gold market may face correction pressure in the short term, the long-term upward trend of gold has not changed. Factors such as global economic and political uncertainty, the Federal Reserve's monetary policy and geopolitical risks will continue to be the main driving force supporting gold prices. The PMI data of European and American countries in March will be released on this trading day, and investors need to pay close attention.
Technical Review:
The gold daily line fell and rebounded on Friday. After a sharp retracement of the 3000 mark, the gold price closed above 3020. The daily closing price was still above the MA10/7-day moving average. The RSI indicator was running at a high value of 70. As of now, the MA10/7-day moving average still remains open upward at 3023/3000 respectively! In the short-term four-hour chart, the gold price is in the middle and lower track of the Bollinger Band. The MA10/7-day moving average opens downward and currently suppresses 3028 and the middle track of the Bollinger Band at 3032. The RSI indicator returns to the middle axis 50 value for sorting. The hourly chart RSI indicator runs below the middle axis and the moving average is glued together, and the price is in the middle track of the Bollinger Band. It is expected that the trading at the beginning of the week will maintain a large range of consolidation!
Today's analysis:
From the large-scale weekly chart, the long-term bullish trend of gold remains unchanged. After the previous big negative correction, it has risen for three consecutive weeks. The bulls are stable. Last week, the overall market rose and fell. The price stabilized at 2982 at the beginning of the week and soared all the way to 3057 and fell back. The closing price was near 3023. The weekly K closed with a small positive line with an upper shadow. The short-term bullish structure remains unchanged, but it is necessary to pay attention to the short-term correction pressure brought by the upper shadow line to correct the short-term moving average indicator. The current 5-week moving average is near 2941 and the 10-week moving average is at 2872. The correction is completed and the bullish trend remains unchanged. After the market rose to the 3057 line, the bulls took profits. The market ran a downward trend, and the price touched the 2999 line at the lowest. The current decline is just a correction to the previous rise. After the correction, it continues to be bullish. Last Friday night, the market fell sharply and then bottomed out and rebounded, and the K line rebounded! As for whether the correction is over, from the perspective of form, this wave of falling K-line is running a double positive correction with consecutive negative declines, and then we need to pay attention to whether the market will rebound with three consecutive positives to restart the upward trend, or turn negative and continue to fall. Considering that the current technical side is biased towards selling, the short-term operation is mainly based on selling at high prices below 3038, supplemented by buying at low prices.
Operation ideas:
Buy short-term gold at 3000-3003, stop loss at 2992, target at 3020-3030;
Sell short-term gold at 3037-3040, stop loss at 3048, target at 3010-3000;
Key points:
First support level: 3013, second support level: 3005, third support level: 2992
First resistance level: 3030, second resistance level: 3035, third resistance level: 3046
Disclaimer
The information and publications are not meant to be, and do not constitute, financial, investment, trading, or other types of advice or recommendations supplied or endorsed by TradingView. Read more in the Terms of Use.
Disclaimer
The information and publications are not meant to be, and do not constitute, financial, investment, trading, or other types of advice or recommendations supplied or endorsed by TradingView. Read more in the Terms of Use.