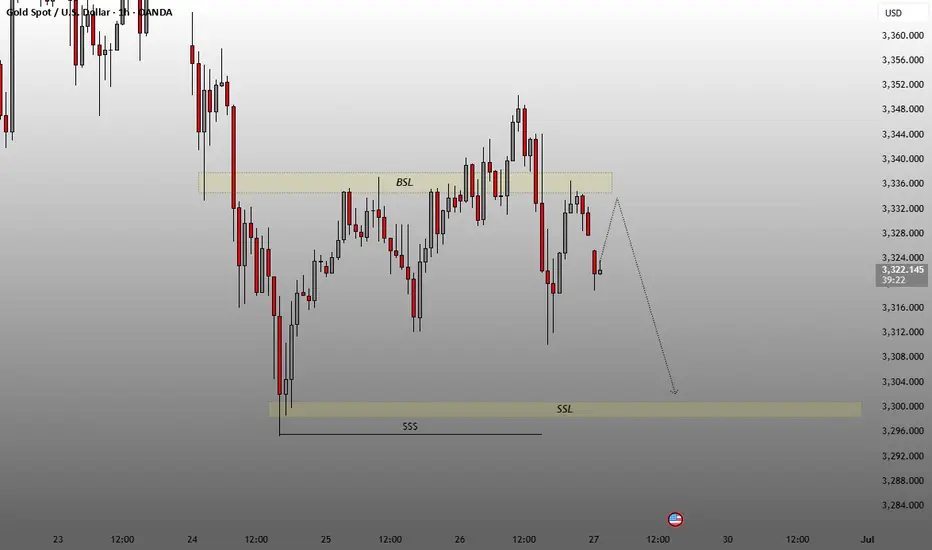
Instrument: XAU/USD (Gold Spot vs US Dollar)
Timeframe: 1 hour (1h)
Current Price: Approximately $3,322.345
🔍
Marked Zones and Labels
BSL (Buy-side Liquidity): Highlighted near the top yellow zone around the $3,336 - $3,344 range.
Price previously swept above this zone and then reversed, indicating a liquidity grab.
SSL (Sell-side Liquidity): Indicated near the bottom zone, around the $3,300 level.
This suggests a potential target area for price to draw down into.
Supply Zone: The top yellow rectangle, where price was previously rejected.
Demand Zone (or Support): The bottom yellow rectangle labeled with “SSS” (possibly short for “Strong Support Structure”).
📉
Price Action & Forecast
A downward arrow projection is drawn, suggesting a bearish bias.
After grabbing buy-side liquidity (BSL), the expectation is for the market to seek sell-side liquidity (SSL).
Potential downside target near $3,300 or below.
Disclaimer
The information and publications are not meant to be, and do not constitute, financial, investment, trading, or other types of advice or recommendations supplied or endorsed by TradingView. Read more in the Terms of Use.
Disclaimer
The information and publications are not meant to be, and do not constitute, financial, investment, trading, or other types of advice or recommendations supplied or endorsed by TradingView. Read more in the Terms of Use.