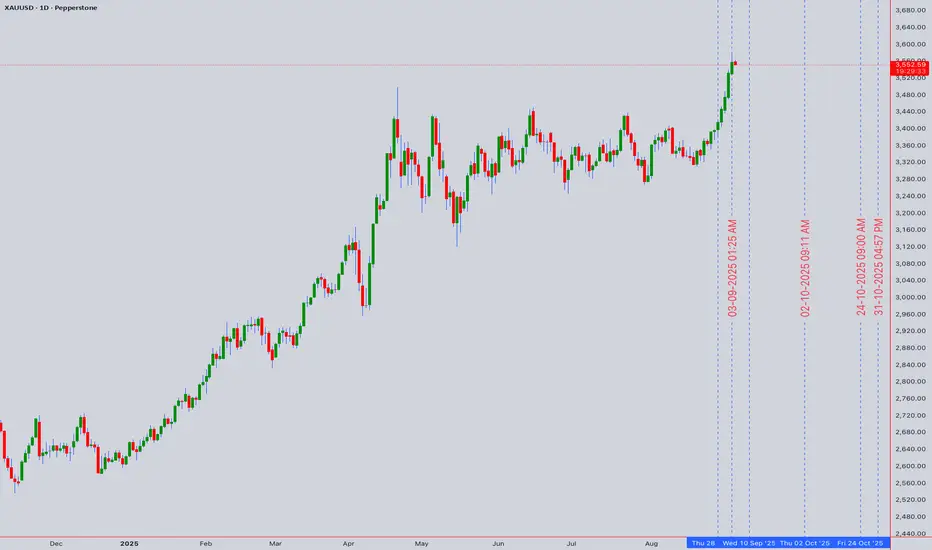
Golden Ascent Faces Key Resistance at $3,600
Asset: XAUUSD (Gold Spot vs. US Dollar)
Analysis Date: September 4, 2025
Open Price: $3,560 (as of 12:54 AM UTC+4)
Timeframes Analyzed: 5M, 15M, 1H, 4H, D, W
Executive Summary & Market Outlook
Gold (XAUUSD) is exhibiting a strong bullish structure on higher timeframes, currently challenging a critical resistance confluence zone near $3,600. The price action suggests the asset is in a decisive uptrend, but short-term momentum shows signs of potential exhaustion. A clean break above $3,600 could catalyze the next leg up towards $3,650, while a rejection here may trigger a healthy pullback to gather liquidity before the next move. This analysis integrates multi-timeframe signals to provide a roadmap for both intraday traders and swing traders.
Multi-Timeframe Technical Analysis
Our methodology synthesizes classic chart patterns, harmonic price action, and a suite of momentum indicators to identify high-probability scenarios.
1. Trend Analysis (Daily & 4-Hour Chart):
Primary Trend: Bullish. Price is trading well above its key Daily Simple Moving Averages (e.g., SMA 50, SMA 200), which are fanned out and sloping upwards.
Intermediate Trend: Bullish. The series of higher highs (HH) and higher lows (HL) on the 4H chart remains intact. The most recent HL is near the $3,500 level, which now serves as crucial support.
2. Key Chart Patterns & Theories:
Bull Flag Formation (4H): The recent consolidation between ~$3,520 and $3,580 can be interpreted as a bull flag—a continuation pattern. A breakout above $3,580 with increasing volume would project a measured move target approximately $120 higher, aligning with the $3,700 area.
Elliott Wave Theory: Gold appears to be in a mature Wave 3 (or a powerful Wave C of an corrective structure) of a larger impulsive move. This suggests strong momentum but also warns of an eventual Wave 4 pullback. The typical retracement zone for a Wave 4 is between 38.2% and 50% of Wave 3, which would be in the $3,480 - $3,520 range.
Harmonic Patterns: The rally from the recent swing low is approaching a potential Bullish Cypher pattern’s Potential Reversal Zone or a 0.886 Fibonacci retracement of a prior leg, often a profit-taking zone. This reinforces the significance of the $3,590-$3,610 resistance cluster.
3. Critical Support & Resistance Levels:
Resistance (R3): $3,650 - $3,670 (Projected Target)
Resistance (R2): $3,620 (Psychological Level)
Resistance (R1): $3,590 - $3,610 (Key Confluence Zone) - Current hurdle. Contains Fibonacci extensions and previous swing highs.
Current Open Price: ~$3,560
Support (S1): $3,540 - $3,550 (Immediate Pullback Support)
Support (S2): $3,500 - $3,520 (Primary Support) - Must hold for bullish structure. Aligns with the 50-period EMA on 4H and previous resistance turned support.
Support (S3): $3,450 (Major Swing Low)
4. Indicator Consensus:
RSI (14-period on 4H): Reading is near 65. It is in bullish territory but has not yet reached overbought (>70), suggesting there is room for further upside, though a minor divergence could signal a brief pause.
Bollinger Bands (4H): Price is riding the upper band, a sign of strong momentum. A move back inside the bands would indicate a slowdown in the pace of the advance.
Moving Averages: The order of the EMAs (8 > 21 > 50 > 200) on the 4H and 1H charts confirms a strong bullish trend alignment. Any pullback is likely to find dynamic support at the 21-period EMA.
Volume & VWAP: Volume has been steady on up moves. The Anchored VWAP (likely from a recent significant low) shows price trading well above the mean, indicating strong buyer control. A break below the VWAP could signal a deeper retracement.
Trading Strategy & Forecast
A. Intraday Trading Strategy (5M - 1H Charts):
Bullish Scenario (Breakout Play): Wait for a strong 1H or 4H close above $3,590 with supporting volume. Entry: On a retest of $3,590 as support or a small pullback. Stop Loss: Below $3,575. Target: $3,620 (TP1), $3,650 (TP2).
Bearish Scenario (Rejection Play): If price shows clear rejection at $3,590 (e.g., long upper wicks, bearish engulfing patterns on 1H), consider a short for a pullback to S1. Entry: On confirmation of rejection. Stop Loss: Tight, above $3,610. Target: $3,540 - $3,550.
Range Trade: If price remains contained between $3,540 and $3,590, traders can fade the extremes with tight stop losses.
B. Swing Trading Strategy (4H - D Charts):
Bullish Bias: The overall strategy should be to buy the dips within the bullish trend. The most attractive long entries for swing traders are near the key support confluence at $3,500 - $3,520. A break and hold above $3,610 opens the path to $3,650+.
Bearish Risk: A daily close below $3,500 would violate the higher low structure and suggest a deeper correction is underway, potentially towards $3,450. This would invalidate the immediate bullish outlook.
Risk Management & Conclusion
Key Risk Events: Monitor upcoming US economic data (NFP, CPI) and any shifts in geopolitical tensions or Federal Reserve rhetoric, as these are primary drivers for gold volatility.
Position Sizing: Always risk no more than 1-2% of your capital on a single trade. The volatile nature of gold necessitates disciplined risk management.
Conclusion: The technical picture for XAUUSD is bullish but at an inflection point. The battle between bulls and bears is concentrated at the $3,590-$3,610 resistance wall. A successful breakout paves the way for a continued rally, while a rejection could see a short-term correction to gather energy for the next attempt. Traders should be agile, respect key levels, and align their strategies with the higher-timeframe trend.
Overall Bias: 🟢 Bullish above $3,520 | Bearish below $3,500
Disclaimer: This analysis is for informational purposes only and does not constitute financial advice. Trading financial instruments carries a high level of risk and may not be suitable for all investors. Always conduct your own research and consider seeking advice from an independent financial advisor before making any trading decisions.
I am nothing
Disclaimer
The information and publications are not meant to be, and do not constitute, financial, investment, trading, or other types of advice or recommendations supplied or endorsed by TradingView. Read more in the Terms of Use.
I am nothing
Disclaimer
The information and publications are not meant to be, and do not constitute, financial, investment, trading, or other types of advice or recommendations supplied or endorsed by TradingView. Read more in the Terms of Use.