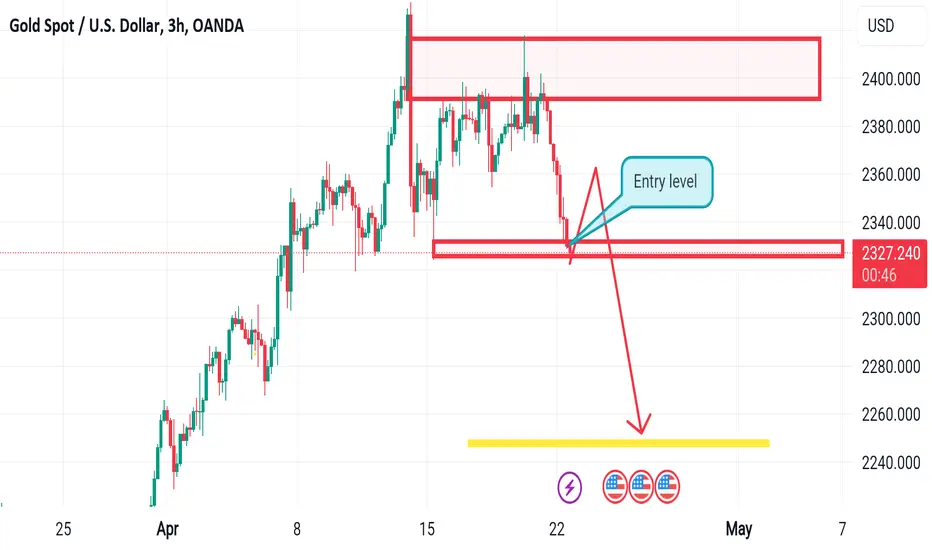
XAU/USD trades near $2,371 and the daily chart shows that the slide may continue. Technical indicators retreat from extreme overbought levels, suggesting the decline may continue. Still, a steeper slide remains out of the picture, as XAU/USD refuses to give up developing its moving averages above all Simple Moving Average (SMA) maintains its firmly bullish slope at around $2,280 and roughly $300 above an also bullish 100 SMA
Note
As you see gold continue sellNote
Hold OnDisclaimer
The information and publications are not meant to be, and do not constitute, financial, investment, trading, or other types of advice or recommendations supplied or endorsed by TradingView. Read more in the Terms of Use.
Disclaimer
The information and publications are not meant to be, and do not constitute, financial, investment, trading, or other types of advice or recommendations supplied or endorsed by TradingView. Read more in the Terms of Use.