Market news:
This week (June 2 to June 6), the spot gold market has become more volatile due to the interweaving of multiple factors. Spot gold prices fell more than 1% on Friday due to the impact of strong US employment data, but still recorded a 0.8% increase for the whole week, showing the game between safe-haven demand and the strengthening of the US dollar. The trade uncertainty caused by Trump's tariff policy, the continued increase in international gold holdings by global central banks, and the tense geopolitical situation provide support for London gold prices, while the solid US employment data pushed up US Treasury yields, weakened the Fed's expectations of rate cuts, and put pressure on international gold prices. The market continues to pay attention to geopolitical risks and trade uncertainties. Silver performed even better, hitting its highest level since 2012, and platinum and palladium also recorded weekly gains. The precious metals market as a whole was driven by speculative funds. The market's uncertainty about the Trump administration's steel and aluminum tariffs and fiscal policies has driven global central banks to increase their gold holdings. And the cautious attitude of Federal Reserve officials towards rate cuts is beneficial to long-term demand for gold. Next week, the US CPI data and the progress of trade negotiations will become the focus of the market. If inflationary pressure rises, it may further push up US bond yields and put pressure on gold prices; if the data is soft, it may rekindle expectations of interest rate cuts, which is good for gold. In addition, the progress of trade negotiations and geopolitical risks such as the conflict between Russia and Ukraine will continue to affect market sentiment.
Technical Review:
From the perspective of this week's market, the high-rise and fall-down trend continued, and the low point was refreshed. The signal that gold is heading towards an extremely weak pattern is getting stronger and stronger, and selling has the capital to pierce 3300. From a technical perspective, on the weekly chart, this week's high-rise and fall closed with an inverted head, and the MACD indicator showed signs of a dead cross downward at a high level. The current pattern is conducive to continued selling! On the daily chart, two consecutive negative lines on the daily chart caused the price to run below the short-term moving average, and led to a downward trend near the 10-day moving average of 3330. The 5-day moving average also followed closely at around 3355. In addition, the upward momentum of other periodic indicators weakened, and the MACD indicator showed a dead cross downward pattern, so the daily chart should tend to be short. However, one thing is worth noting, that is, after the gold price rebounded at 3307 on Friday, the middle track of the Bollinger Band has moved up, which means that the buying defense has been strengthened. Therefore, while the daily line is biased towards selling, we must also pay attention to the strength of the bulls' counterattack.
Next week's analysis:
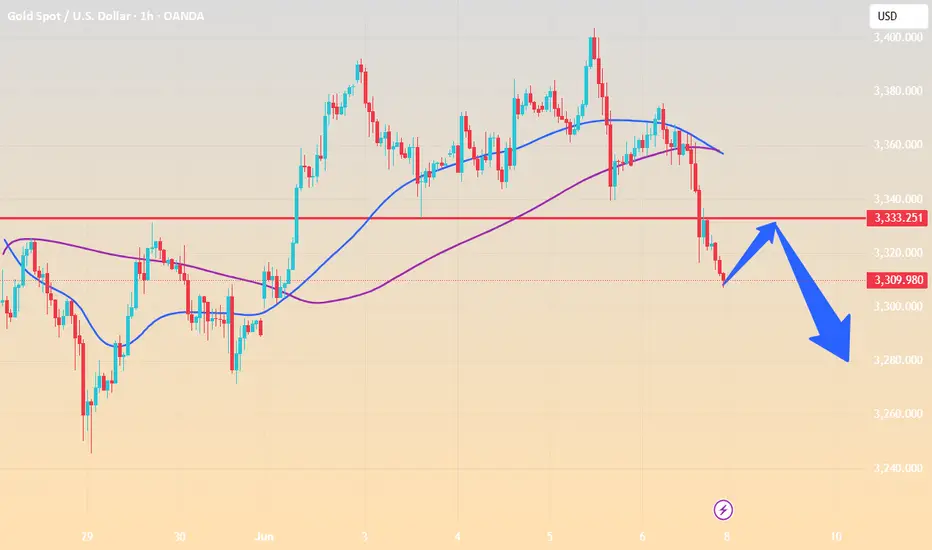
Next week's operation suggestion is to maintain the idea of selling as the main idea, supplemented by buying at low prices. For the upper resistance, pay attention to the 3328-3330 area first, and then pay attention to the 3345-3350 area. The former is regarded as the key to selling and exploring the low point, or even breaking the middle track of the Bollinger Band at 3295, which is also the low point of this week. The latter is a strong defense for selling in the short-term shock trend! In other words, selling below 3330 can complete the touch of the low point or new low next week in the short term, while selling below 3350 is still expected to test the new low, but the time period will be extended. As for the support below, focus on 3280. It is expected that it will be close to or touched at the beginning of next week, but whether it can break directly needs to be judged according to the actual trend, so it is best to wait for it to touch or break once before taking more. The 1-hour moving average of gold has formed a dead cross downward, so gold still has downward momentum. After the 1-hour high box of gold oscillated, gold finally broke through the box downward, indicating that gold is better sold. Then the bottom of the gold box has now formed resistance, and the short-term 3333 line of gold has formed resistance to gold. If gold is under pressure at 3333 at the beginning of next week, then gold can continue to be sold.
Operation ideas:
Buy short-term gold at 3277-3280, stop loss at 3268, target at 3310-3330;
Sell short-term gold at 3330-3333, stop loss at 3342, target at 3300-3280;
Key points:
First support level: 3300, second support level: 3280, third support level: 3261
First resistance level: 3330, second resistance level: 3348, third resistance level: 3375
This week (June 2 to June 6), the spot gold market has become more volatile due to the interweaving of multiple factors. Spot gold prices fell more than 1% on Friday due to the impact of strong US employment data, but still recorded a 0.8% increase for the whole week, showing the game between safe-haven demand and the strengthening of the US dollar. The trade uncertainty caused by Trump's tariff policy, the continued increase in international gold holdings by global central banks, and the tense geopolitical situation provide support for London gold prices, while the solid US employment data pushed up US Treasury yields, weakened the Fed's expectations of rate cuts, and put pressure on international gold prices. The market continues to pay attention to geopolitical risks and trade uncertainties. Silver performed even better, hitting its highest level since 2012, and platinum and palladium also recorded weekly gains. The precious metals market as a whole was driven by speculative funds. The market's uncertainty about the Trump administration's steel and aluminum tariffs and fiscal policies has driven global central banks to increase their gold holdings. And the cautious attitude of Federal Reserve officials towards rate cuts is beneficial to long-term demand for gold. Next week, the US CPI data and the progress of trade negotiations will become the focus of the market. If inflationary pressure rises, it may further push up US bond yields and put pressure on gold prices; if the data is soft, it may rekindle expectations of interest rate cuts, which is good for gold. In addition, the progress of trade negotiations and geopolitical risks such as the conflict between Russia and Ukraine will continue to affect market sentiment.
Technical Review:
From the perspective of this week's market, the high-rise and fall-down trend continued, and the low point was refreshed. The signal that gold is heading towards an extremely weak pattern is getting stronger and stronger, and selling has the capital to pierce 3300. From a technical perspective, on the weekly chart, this week's high-rise and fall closed with an inverted head, and the MACD indicator showed signs of a dead cross downward at a high level. The current pattern is conducive to continued selling! On the daily chart, two consecutive negative lines on the daily chart caused the price to run below the short-term moving average, and led to a downward trend near the 10-day moving average of 3330. The 5-day moving average also followed closely at around 3355. In addition, the upward momentum of other periodic indicators weakened, and the MACD indicator showed a dead cross downward pattern, so the daily chart should tend to be short. However, one thing is worth noting, that is, after the gold price rebounded at 3307 on Friday, the middle track of the Bollinger Band has moved up, which means that the buying defense has been strengthened. Therefore, while the daily line is biased towards selling, we must also pay attention to the strength of the bulls' counterattack.
Next week's analysis:
Next week's operation suggestion is to maintain the idea of selling as the main idea, supplemented by buying at low prices. For the upper resistance, pay attention to the 3328-3330 area first, and then pay attention to the 3345-3350 area. The former is regarded as the key to selling and exploring the low point, or even breaking the middle track of the Bollinger Band at 3295, which is also the low point of this week. The latter is a strong defense for selling in the short-term shock trend! In other words, selling below 3330 can complete the touch of the low point or new low next week in the short term, while selling below 3350 is still expected to test the new low, but the time period will be extended. As for the support below, focus on 3280. It is expected that it will be close to or touched at the beginning of next week, but whether it can break directly needs to be judged according to the actual trend, so it is best to wait for it to touch or break once before taking more. The 1-hour moving average of gold has formed a dead cross downward, so gold still has downward momentum. After the 1-hour high box of gold oscillated, gold finally broke through the box downward, indicating that gold is better sold. Then the bottom of the gold box has now formed resistance, and the short-term 3333 line of gold has formed resistance to gold. If gold is under pressure at 3333 at the beginning of next week, then gold can continue to be sold.
Operation ideas:
Buy short-term gold at 3277-3280, stop loss at 3268, target at 3310-3330;
Sell short-term gold at 3330-3333, stop loss at 3342, target at 3300-3280;
Key points:
First support level: 3300, second support level: 3280, third support level: 3261
First resistance level: 3330, second resistance level: 3348, third resistance level: 3375
Disclaimer
The information and publications are not meant to be, and do not constitute, financial, investment, trading, or other types of advice or recommendations supplied or endorsed by TradingView. Read more in the Terms of Use.
Disclaimer
The information and publications are not meant to be, and do not constitute, financial, investment, trading, or other types of advice or recommendations supplied or endorsed by TradingView. Read more in the Terms of Use.