Gold technical analysis
Daily chart resistance level 3340, support level below 3245
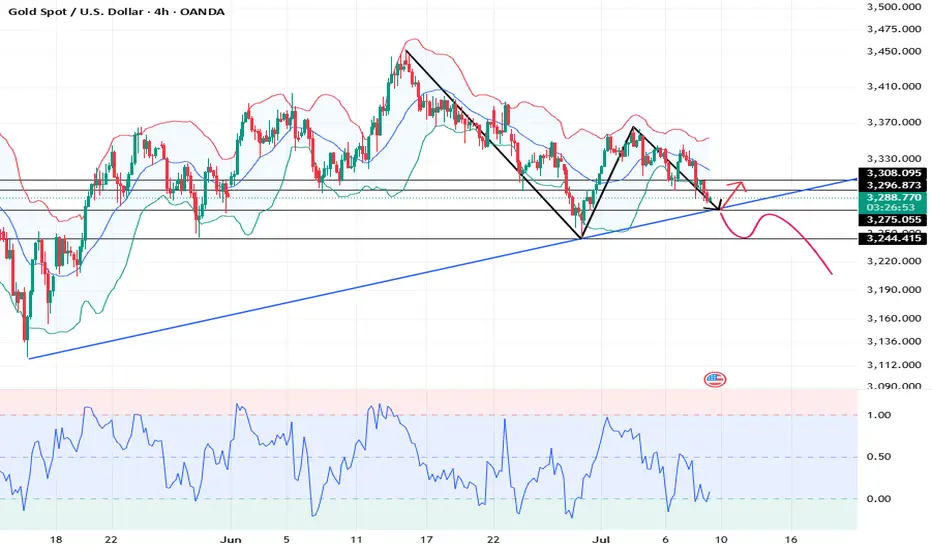
Four-hour chart resistance level 3308, support level below 3264
One-hour chart resistance level 3296, support level below 3275.
The expectation that the Fed will keep interest rates unchanged in July has been widely accepted by the market, mainly because Trump announced that he would increase import tariffs on goods from many countries from August 1, triggering market concerns about rising inflation. This expectation pushed up the US 10-year Treasury yield, supporting the dollar to a two-week high, which put gold under downward pressure. On Tuesday, gold closed sharply lower at the daily level, with ma5 and ma10 running downward, indicating that the bears once again dominated. Today, the price of gold may continue to fall. Pay attention to the support near the lower track 3275. If the price of gold closes the real falling candle again today, it will drive the Bollinger Band opening downward, which will further confirm the downward trend. The market may start a new round of decline in the future. The 4-hour level K line continues to fall, and the Bollinger Band opening expands downward! The short-term key support position below is around 3275. After breaking through, it may fall to the previous low of 3266-3245; the important pressure position is around 3308!
SELL: 3296near
SELL: 3308near
BUY: 3250near
Daily chart resistance level 3340, support level below 3245
Four-hour chart resistance level 3308, support level below 3264
One-hour chart resistance level 3296, support level below 3275.
The expectation that the Fed will keep interest rates unchanged in July has been widely accepted by the market, mainly because Trump announced that he would increase import tariffs on goods from many countries from August 1, triggering market concerns about rising inflation. This expectation pushed up the US 10-year Treasury yield, supporting the dollar to a two-week high, which put gold under downward pressure. On Tuesday, gold closed sharply lower at the daily level, with ma5 and ma10 running downward, indicating that the bears once again dominated. Today, the price of gold may continue to fall. Pay attention to the support near the lower track 3275. If the price of gold closes the real falling candle again today, it will drive the Bollinger Band opening downward, which will further confirm the downward trend. The market may start a new round of decline in the future. The 4-hour level K line continues to fall, and the Bollinger Band opening expands downward! The short-term key support position below is around 3275. After breaking through, it may fall to the previous low of 3266-3245; the important pressure position is around 3308!
SELL: 3296near
SELL: 3308near
BUY: 3250near
Trade active
Accurate prediction. 3296 fell to 3283💥Telegram Channel Free Updates 👉🏻
💥t.me/Actuary00group
✉️Gold Signal and daily analysis channel
💥t.me/Actuary00group
✉️Gold Signal and daily analysis channel
Disclaimer
The information and publications are not meant to be, and do not constitute, financial, investment, trading, or other types of advice or recommendations supplied or endorsed by TradingView. Read more in the Terms of Use.
💥Telegram Channel Free Updates 👉🏻
💥t.me/Actuary00group
✉️Gold Signal and daily analysis channel
💥t.me/Actuary00group
✉️Gold Signal and daily analysis channel
Disclaimer
The information and publications are not meant to be, and do not constitute, financial, investment, trading, or other types of advice or recommendations supplied or endorsed by TradingView. Read more in the Terms of Use.