1. "Bullish Breakout Anticipation: Gold Eyes $3,435 Zone"
This title emphasizes the potential breakout scenario:
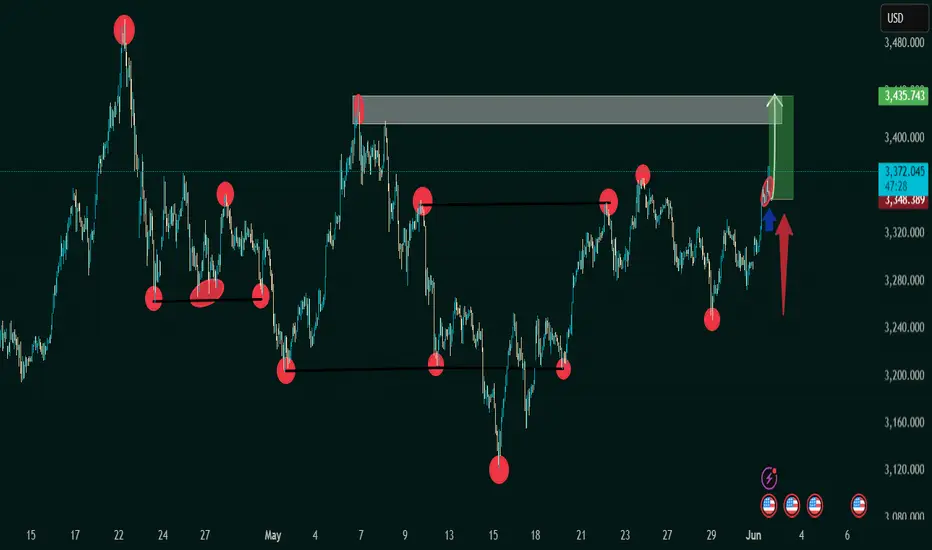
The chart shows price pushing into a previous supply zone (highlighted rectangle).
The green box and arrow indicate a bullish target near $3,435.
Key resistance has been tested multiple times (red circles), suggesting weakening seller control.
📈 2. "Double Bottom Reversal Validates Bullish Momentum in XAU/USD"
This reflects a technical pattern recognition:
A potential double bottom forms near the May 15th and late May lows.
The breakout from the neckline (around $3,350–$3,370) confirms the reversal.
Red-to-green zone suggests the projected move post-breakout.
🔄 3. "Range Consolidation Broken: XAU/USD Breaks Key Resistance"
Focuses on market structure:
Horizontal support/resistance lines indicate a range-bound market.
The recent move above previous highs signals a range breakout.
Blue arrow suggests a retest could offer a long entry point.
💡 4. "Buy Opportunity Triggered on Retest: Targeting Supply Zone Break"
This suits a trading plan scenario:
Red and blue arrows suggest a pullback-and-go trade setup.
The price may revisit the breakout level (~$3,348) before heading higher.
The green zone is the profit target area.
⚔️ 5. "Battle of Supply and Demand: Bulls Gaining Control Above $3,370"
Captures the market sentiment shift:
Multiple failed attempts to break lower (marked with red circles).
Final bullish breakout shows momentum shift to buyers.
If volume confirms, the breakout could be strong and sustained.
This title emphasizes the potential breakout scenario:
The chart shows price pushing into a previous supply zone (highlighted rectangle).
The green box and arrow indicate a bullish target near $3,435.
Key resistance has been tested multiple times (red circles), suggesting weakening seller control.
📈 2. "Double Bottom Reversal Validates Bullish Momentum in XAU/USD"
This reflects a technical pattern recognition:
A potential double bottom forms near the May 15th and late May lows.
The breakout from the neckline (around $3,350–$3,370) confirms the reversal.
Red-to-green zone suggests the projected move post-breakout.
🔄 3. "Range Consolidation Broken: XAU/USD Breaks Key Resistance"
Focuses on market structure:
Horizontal support/resistance lines indicate a range-bound market.
The recent move above previous highs signals a range breakout.
Blue arrow suggests a retest could offer a long entry point.
💡 4. "Buy Opportunity Triggered on Retest: Targeting Supply Zone Break"
This suits a trading plan scenario:
Red and blue arrows suggest a pullback-and-go trade setup.
The price may revisit the breakout level (~$3,348) before heading higher.
The green zone is the profit target area.
⚔️ 5. "Battle of Supply and Demand: Bulls Gaining Control Above $3,370"
Captures the market sentiment shift:
Multiple failed attempts to break lower (marked with red circles).
Final bullish breakout shows momentum shift to buyers.
If volume confirms, the breakout could be strong and sustained.
Trade active
taede actie 150+ runningMarket Analyst | Forex Mentor | XAUUSD Specialist
Services Offered:
• VIP Signals
• 1-on-1 Mentorship
• Professional Forex Course
• Affiliate Program
• Strategic Partnerships
Link to Join
t.me/ZareeFxTradingSignals
Services Offered:
• VIP Signals
• 1-on-1 Mentorship
• Professional Forex Course
• Affiliate Program
• Strategic Partnerships
Link to Join
t.me/ZareeFxTradingSignals
Related publications
Disclaimer
The information and publications are not meant to be, and do not constitute, financial, investment, trading, or other types of advice or recommendations supplied or endorsed by TradingView. Read more in the Terms of Use.
Market Analyst | Forex Mentor | XAUUSD Specialist
Services Offered:
• VIP Signals
• 1-on-1 Mentorship
• Professional Forex Course
• Affiliate Program
• Strategic Partnerships
Link to Join
t.me/ZareeFxTradingSignals
Services Offered:
• VIP Signals
• 1-on-1 Mentorship
• Professional Forex Course
• Affiliate Program
• Strategic Partnerships
Link to Join
t.me/ZareeFxTradingSignals
Related publications
Disclaimer
The information and publications are not meant to be, and do not constitute, financial, investment, trading, or other types of advice or recommendations supplied or endorsed by TradingView. Read more in the Terms of Use.