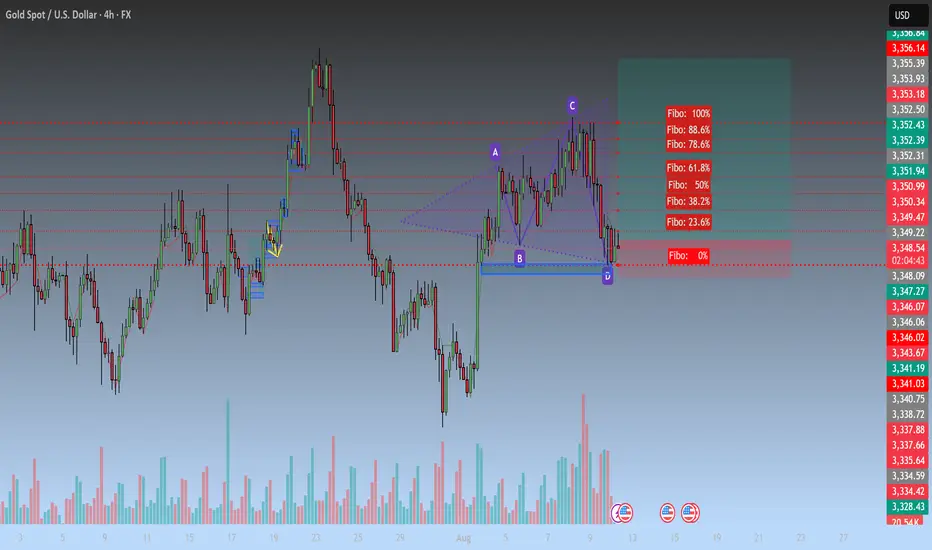
On the 4H timeframe, gold is forming a Bullish Harmonic structure (likely a Gartley or Bat pattern), with point D appearing around the strong support zone 3,349 – 3,346 USD, aligning with the 0% Fibonacci level and previous swing low.
1. Technical Breakdown
Harmonic Pattern:
A → B: Strong bearish leg.
B → C: Retracement to the 61.8 – 78.6% Fibo zone.
C → D: Decline to the 88.6 – 100% Fibo zone, touching a strong support area and giving potential reversal signals.
Fibonacci Retracement Key Levels:
50%: 3,352 USD.
61.8%: 3,353 – 3,354 USD.
78.6% – 88.6%: 3,355 – 3,356 USD (near-term resistance target).
Volume: Bullish wick candles at point D with higher volume, indicating bottom-picking activity.
EMA: Price is currently testing the short-term EMA; a successful breakout could open the way toward higher resistance levels.

2. Trading Scenarios
Scenario 1 – Buy following the Harmonic pattern (Preferred):
Entry: 3,349 – 3,350 USD.
Stop Loss: 3,343 USD (just below point D by ~6–7 USD).
TP1: 3,352 USD (Fibo 50%).
TP2: 3,355 USD (Fibo 61.8%).
TP3: 3,358 USD (major resistance + Fibo 78.6%).
RRR: ~4.8 as seen on the chart, suitable for short-term swing setups.
Scenario 2 – Sell against the pattern (High Risk):
Only consider if price breaks strongly below 3,343 USD with high volume.
Target: 3,338 – 3,335 USD.
3. Key Notes
Prioritize buying as long as price holds above point D with bullish confirmation on H1–H4 timeframes.
If price rallies but fails to break above 3,355 USD, consider partial profit-taking and moving SL to breakeven.
Risk management: limit to 1–2% per trade, avoid FOMO entries.
1. Technical Breakdown
Harmonic Pattern:
A → B: Strong bearish leg.
B → C: Retracement to the 61.8 – 78.6% Fibo zone.
C → D: Decline to the 88.6 – 100% Fibo zone, touching a strong support area and giving potential reversal signals.
Fibonacci Retracement Key Levels:
50%: 3,352 USD.
61.8%: 3,353 – 3,354 USD.
78.6% – 88.6%: 3,355 – 3,356 USD (near-term resistance target).
Volume: Bullish wick candles at point D with higher volume, indicating bottom-picking activity.
EMA: Price is currently testing the short-term EMA; a successful breakout could open the way toward higher resistance levels.
2. Trading Scenarios
Scenario 1 – Buy following the Harmonic pattern (Preferred):
Entry: 3,349 – 3,350 USD.
Stop Loss: 3,343 USD (just below point D by ~6–7 USD).
TP1: 3,352 USD (Fibo 50%).
TP2: 3,355 USD (Fibo 61.8%).
TP3: 3,358 USD (major resistance + Fibo 78.6%).
RRR: ~4.8 as seen on the chart, suitable for short-term swing setups.
Scenario 2 – Sell against the pattern (High Risk):
Only consider if price breaks strongly below 3,343 USD with high volume.
Target: 3,338 – 3,335 USD.
3. Key Notes
Prioritize buying as long as price holds above point D with bullish confirmation on H1–H4 timeframes.
If price rallies but fails to break above 3,355 USD, consider partial profit-taking and moving SL to breakeven.
Risk management: limit to 1–2% per trade, avoid FOMO entries.
🪙 JOIN OUR FREE TELEGRAM GROUP 🪙
t.me/dnaprofits
Join the community group to get support and share knowledge!
️🥇 Exchange and learn market knowledge
️🥇 Support free trading signals
t.me/dnaprofits
Join the community group to get support and share knowledge!
️🥇 Exchange and learn market knowledge
️🥇 Support free trading signals
Related publications
Disclaimer
The information and publications are not meant to be, and do not constitute, financial, investment, trading, or other types of advice or recommendations supplied or endorsed by TradingView. Read more in the Terms of Use.