This is a new idea I have been working on lately which is an extension of my current ideas, that gold is in a downtrend still, and that price should reach the 16xx mark again. I have drawn up technicals on a D chart which have then been detailed into 4H, 1H and 15M charts.
You can obviously copy and make any changes you deem necessary, change visibility on certain drawings etc.
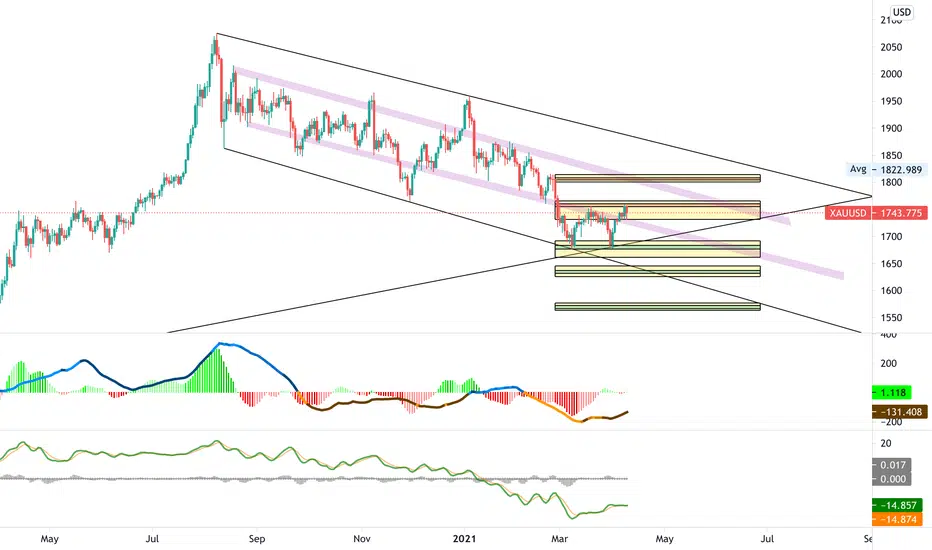
How I have made the drawings to be understood:
Yellow = Daily demand zones
Purple = Daily inside trend lines/zones
Red = Daily resistance/pivot
Green = Daily support/pivot
Blue = Pivot points/demand zones (you can treat them however you wish as support or resistance).
Let me know in the comment section if you do use this chart and how you feel it plays out.
*This is my opinion, trade at your own risk.
Patience and risk management.
Link to chart: uk.tradingview.com/chart/Nf2Mvvop/
You can obviously copy and make any changes you deem necessary, change visibility on certain drawings etc.
How I have made the drawings to be understood:
Yellow = Daily demand zones
Purple = Daily inside trend lines/zones
Red = Daily resistance/pivot
Green = Daily support/pivot
Blue = Pivot points/demand zones (you can treat them however you wish as support or resistance).
Let me know in the comment section if you do use this chart and how you feel it plays out.
*This is my opinion, trade at your own risk.
Patience and risk management.
Link to chart: uk.tradingview.com/chart/Nf2Mvvop/
Note
1720 should be a key area to watch - this could be a potential lower high as weekly indicators are all bottomed out. This downtrend could also be a retracement as 1670 is on the 50 IFB on M TF with a DB on lower TF.Trade active
H&S on 1H Chart, if pattern confirmed TP1, 2 and 3 are shown as Trend Based Fibs based off the length of the head to the neckline.
Note
Daily close below Friday and Thursday close will signal a bearish market for Asia with 1720 in sight, Asia could lead into London breaking the H&S giving us 1700-1705. Daily stochastic has crossed and 4H still has some room to go down a little more before the bull run comes...
DXY however seems to have found resistance which could indicate more bearish moves on XAUUSD.
Trade active
Currently consolidation/ranging.
Wait for breakout which will most likely be triggered by CPI in the 1 hour.
Trade active
So we had the box broken and exactly as I called it - due to CPI Now we are currently ranging/consolidating again watch for a break of the box again which give an indication of trend - bearing in mind this is supposed to be a bullish rectangle due to the up trend that initiate it.
However we are also in what could be a descending triangle like last time - I copy and pasted the previous one to fit this one.
So 2 key factors to consider, the box and the potential triangle. The box breaking down confirms the triangle pattern.
If broken up we will have to test the resistance at the 50-60 mark as drawn on the graph.
Trade active
Copy and Paste triangle is working out.
If 1750 is broken I suspect we may be in for 1770-80.
Neckline acted as support at 38FIB from bottom to top of D impulse which could signify ABC the correction wave from downtrend, A-B would be the 38FIB retracement.
Key areas to watch right now in my opinion would be the break of the triangle and 1750-60.
Trade active
Potential C&H with targets. Entry at TL break with SL below most recent low with TP1, 2 and 3 shown.
Trade active
For those who managed to get in.... Well done! Note
Key areas to watch, 60-70. If break of 70 then expect 1780-1800.
If break of 60 then expect 50 for next 50.
Elliot correction wave (ABC) to 1780 could give us the start of a drop to 1600 again as originally planned.
Trade active
This week finished off as expected. Bouncing off a TL if taking a fakeout into consideration.
We could possibly see 50 as a retracement for wave C to complete at 1800 as previously said or we could see 16xx again to complete a triple bottom and making a descending triangle to signal a reversal of trend.
For now we watch these 2 key factors a triangle pattern as well as rectangle. Triangle should signal which way the rectangle will be broken.
Note
4H Divergence as well as bounce off TL.
DXY GAP up gives us an indication that gold will be bearish.
Targets are drawn in as S/R on 4H chart attached.
Trade active
C&H currently in play.
Targets shown as seen:
Trade closed: target reached
T1 and 2 reached 3 on its way.
Trade active
Yet again another DB resulting in a C&H, lets make it 3/3?
Trade closed: target reached
We managed to get target 1 and 2 of C&H. Now on to the hold trade.
Disclaimer
The information and publications are not meant to be, and do not constitute, financial, investment, trading, or other types of advice or recommendations supplied or endorsed by TradingView. Read more in the Terms of Use.
Disclaimer
The information and publications are not meant to be, and do not constitute, financial, investment, trading, or other types of advice or recommendations supplied or endorsed by TradingView. Read more in the Terms of Use.