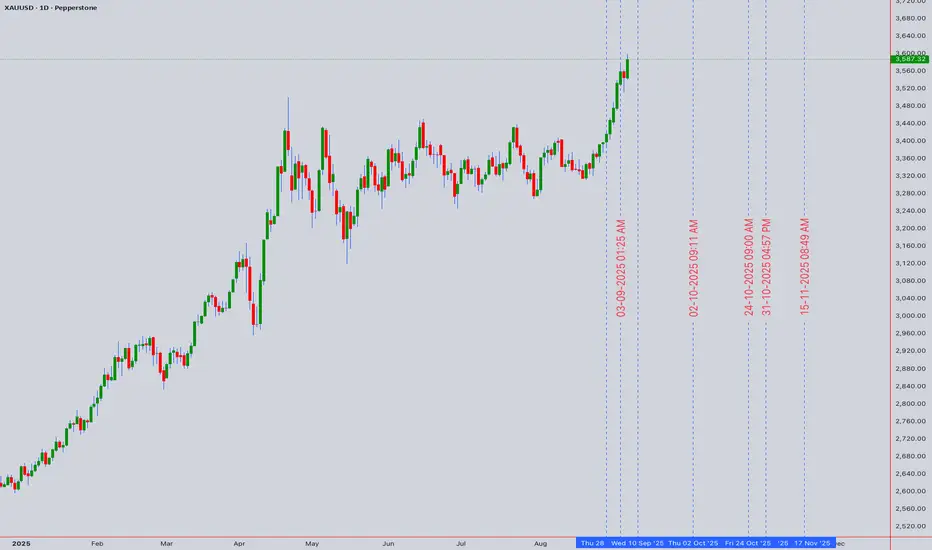
Asset: XAUUSD (Gold Spot / US Dollar)
Analysis Date: September 5, 2025
Current Closing Price: $3,586.54 (as of 12:59 AM UTC+4)
Timeframes Analyzed: 1H, 4H, D, W
Market Context: Record High Territory - Bullish Momentum Sustained
Executive Summary & Market Outlook
Gold (XAUUSD) has executed a critical technical breakout, pushing above the $3,580 resistance and challenging the monumental $3,600 psychological and technical barrier. The asset is in a firm bullish trend but is now testing a zone where profit-taking and fresh selling pressure historically emerge. The price action in the coming sessions will be decisive. A sustained break above $3,600 could trigger a momentum-fueled rally towards $3,650, while a rejection here may form a short-term top, leading to a retracement towards $3,550 support. This analysis integrates multi-timeframe signals for intraday and swing traders.
Multi-Timeframe Technical Analysis
1. Trend Analysis (Daily & 4-Hour Chart):
Primary Trend: Bullish. The sequence of Higher Highs (HH) and Higher Lows (HL) is unequivocal on the daily chart.
Momentum: The breakout above the previous resistance near $3,580 is a significant bullish victory. However, the rapid ascent has left the price extended, increasing the probability of a consolidation or pullback.
2. Key Chart Patterns & Theories:
Breakout & Re-test Pattern: The move above $3,580 has broken the structure of the previous consolidation. The ideal bullish scenario now involves a successful re-test of the $3,580 level as new support. This would confirm the breakout's validity and offer a high-probability long entry.
Elliott Wave Theory: The rally from the last significant low is impulsive in nature. We are likely in a later stage of a Wave 3 or a Wave 5 extension. This suggests that while the trend is up, the cycle is maturing. Wave 4 corrections typically retrace to the 38.2% Fibonacci level of Wave 3, which would be near $3,520.
Gann Theory: The $3,600 level represents a key psychological and mathematical resistance. A decisive break and close above it could open the path to the next Gann angle/resistance level, projected near $3,620-$3,630.
Ichimoku Cloud (H4/D1): Price is trading well above the Senkou Span (Cloud) on both timeframes, confirming the strong bullish trend. The Cloud itself is thick and rising, providing strong dynamic support far below current levels.
3. Critical Support & Resistance Levels:
Resistance (R1): $3,600 - $3,610 (Key Psychological & Technical Barrier)
Resistance (R2): $3,630 (Next Projected Target)
Resistance (R3): $3,650 (Measured Move Target)
Current Closing Price: ~$3,586.54
Support (S1): $3,580 (Previous Resistance - New Potential Support)
Support (S2): $3,550 - $3,555 (Bullish Trend Line & 21-period EMA confluence)
Support (S3): $3,520 (Major Swing Low & 38.2% Fib Retracement)
4. Indicator Consensus:
RSI (14-period on 4H): Reading is in the 68-72 range, touching on overbought territory. This does not signal an immediate reversal but warns that buying momentum may be overextended in the short term. Watch for bearish divergence on the 1H chart for early signs of a pullback.
Bollinger Bands (4H): Price is peeking outside the upper band, a classic sign of a strong trending move. A move back inside the bands will signal a pause in the trend.
Moving Averages: The bullish alignment (EMA8 > EMA21 > EMA50) is perfect on all timeframes. The EMA 21 on the 4H chart (~$3,555) has acted as dynamic support and is a key level for the bullish thesis.
Volume & VWAP: Volume spiked on the initial breakout. The Anchored VWAP (from the recent swing low) shows price is extended above the mean. A pullback to the VWAP would be a healthy development.
Trading Strategy & Forecast
A. Intraday Trading Strategy (5M - 1H Charts):
Bullish Scenario (Breakout Hold): A pullback to the $3,580 - $3,582 area that finds support (e.g., bullish pin bar, engulfing pattern) presents a low-risk long opportunity. Entry: On bullish confirmation at support. Stop Loss: Below $3,575. Target: $3,600 (TP1), $3,610 (TP2).
Bearish Scenario (Rejection at Highs): If price fails to break $3,600 and shows rejection (long upper wicks, RSI divergence), a short trade for a pullback to $3,570 - $3,575 is viable. Entry: On rejection signals. Stop Loss: Tight, above $3,605. Target: $3,565 (S1).
Momentum Breakout: A strong 1H close above $3,605 could be faded with a small long position, targeting $3,620.
B. Swing Trading Strategy (4H - D Charts):
Bullish Bias: The strategy remains "buy the dip." The most attractive zones for adding long positions are a successful re-test of $3,580 or a deeper pullback to the stronger support confluence at $3,550 - $3,555.
Bearish Risk: A daily close back below $3,560 would be a warning sign that the breakout may have failed (a potential bull trap), opening the door for a deeper correction to $3,520. This would invalidate the immediate upside breakout scenario.
Risk Management & Conclusion
Key Risk Events: Monitor for any surprise geopolitical developments or unexpectedly hawkish comments from Fed officials, which could trigger a "flight-to-safety" rally or a dollar-strength selloff in gold, respectively.
Position Sizing: The increased volatility at key levels demands conservative position sizing. Risk no more than 1% of capital per trade.
Conclusion: XAUUSD is at a critical technical and psychological juncture. The breakout is bullish, but the battle for $3,600 is the key to the next directional move. Swing traders should be patient for a better risk/reward entry on a pullback. Intraday traders can play the range between $3,580 and $3,600 until a decisive break occurs. The overall structure favors the bulls, but a period of consolidation is the most likely immediate outcome.
Overall Bias: 🟢 Bullish above $3,555 | 🟡 Neutral/Bearish below $3,560
For individuals seeking to enhance their trading abilities based on the analyses provided, I recommend exploring the mentoring program offered by Shunya Trade. (Website: shunya dot trade)
I would appreciate your feedback on this analysis, as it will serve as a valuable resource for future endeavors.
Sincerely,
Shunya.Trade
Website: shunya dot trade
Disclaimer: This post is intended solely for educational purposes and does not constitute investment advice, financial advice, or trading recommendations. The views expressed herein are derived from technical analysis and are shared for informational purposes only. The stock market inherently carries risks, including the potential for capital loss. Therefore, readers are strongly advised to exercise prudent judgment before making any investment decisions. We assume no liability for any actions taken based on this content. For personalized guidance, it is recommended to consult a certified financial advisor.
I am nothing
Related publications
Disclaimer
The information and publications are not meant to be, and do not constitute, financial, investment, trading, or other types of advice or recommendations supplied or endorsed by TradingView. Read more in the Terms of Use.
I am nothing
Related publications
Disclaimer
The information and publications are not meant to be, and do not constitute, financial, investment, trading, or other types of advice or recommendations supplied or endorsed by TradingView. Read more in the Terms of Use.