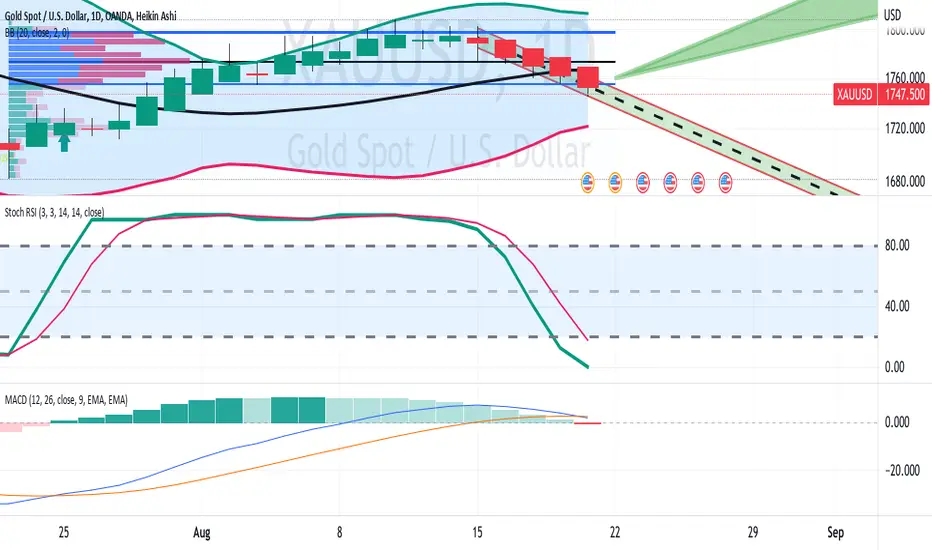
XAUUSD has been in a downtrend on the daily chart
however on the chart I see the basis band of the Bollinger Bands
( SMA20?) on a slow uptrend. Impartantly, the when price
is in the area of the basis band, volatility is increased. Price could
push threw it or bounce. The K line of the RSI indicator is
below the histogram and its slope is decreasing, indicating
that a potential reversal is slowly insuing. Price is below the
POC of the high volume area within the volume profile. The POC
tends to act as a magnet pulling price to itself which would be
an uptrend. Fedral calendar events tend to increase volatility.
All in all, I see a bullish scenario further supported by the cup
and handle disussed in another idea.
dropping
Disclaimer
The information and publications are not meant to be, and do not constitute, financial, investment, trading, or other types of advice or recommendations supplied or endorsed by TradingView. Read more in the Terms of Use.
Disclaimer
The information and publications are not meant to be, and do not constitute, financial, investment, trading, or other types of advice or recommendations supplied or endorsed by TradingView. Read more in the Terms of Use.