🗞News side:
1. The “demand shock” of the Trump administration’s tariffs on the global economy
2. The United States rejected Japan’s request for a comprehensive exemption from 10% reciprocal tariffs and country-specific tariffs in recent negotiations.
3. The conflict between Israel and the Houthis
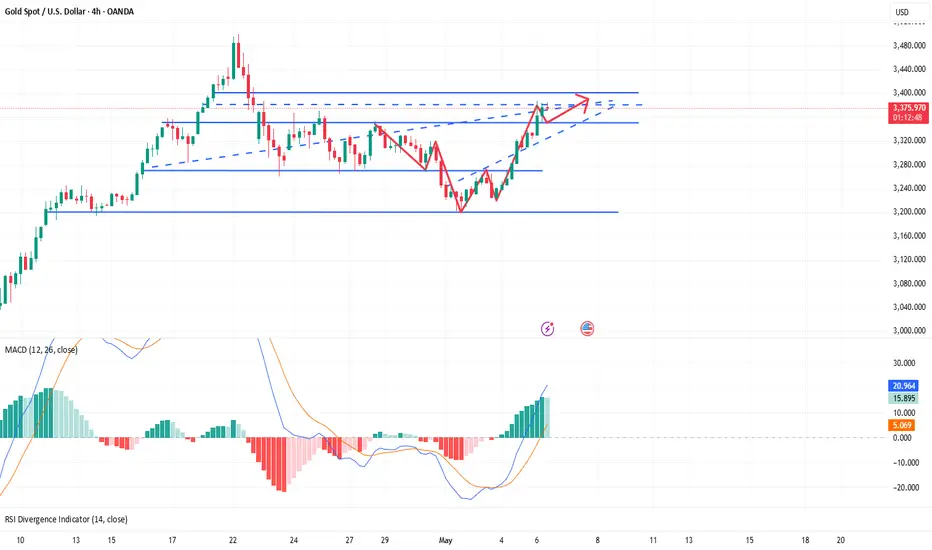
📈Technical aspects:
The 4H golden moving average spreads upward, the MACD golden cross opens upward, and the 4H overall bullish trend is seen. Gold price encountered resistance at 3386 in the morning of the Asian session. This point can be used as a reference in suppressing the market outlook. If this resistance is effectively broken through, bulls are expected to continue to work towards the 3400 first-line mark above. The daily chart is positive, and the K-line combination is relatively strong. The US market is expected to break through 3386 and reach the space above 3400; the SMA10 moving average of 3370 continues to be bullish as the primary support, with strong resistance to 3400. Even if the price of gold in the US market rises and falls, the middle track of the Bollinger Bands still has good support. On the whole, we mainly focus on long positions in short-term trading. We can consider the 3370-3380 layout to go long, with the target looking towards 3400-3410 above.
If you agree with this view, or have a better idea, please leave a message in the comment area. I look forward to hearing different voices.
 GOLD XAUUSD XAUUSD XAUUSD XAUUSD
1. The “demand shock” of the Trump administration’s tariffs on the global economy
2. The United States rejected Japan’s request for a comprehensive exemption from 10% reciprocal tariffs and country-specific tariffs in recent negotiations.
3. The conflict between Israel and the Houthis
📈Technical aspects:
The 4H golden moving average spreads upward, the MACD golden cross opens upward, and the 4H overall bullish trend is seen. Gold price encountered resistance at 3386 in the morning of the Asian session. This point can be used as a reference in suppressing the market outlook. If this resistance is effectively broken through, bulls are expected to continue to work towards the 3400 first-line mark above. The daily chart is positive, and the K-line combination is relatively strong. The US market is expected to break through 3386 and reach the space above 3400; the SMA10 moving average of 3370 continues to be bullish as the primary support, with strong resistance to 3400. Even if the price of gold in the US market rises and falls, the middle track of the Bollinger Bands still has good support. On the whole, we mainly focus on long positions in short-term trading. We can consider the 3370-3380 layout to go long, with the target looking towards 3400-3410 above.
If you agree with this view, or have a better idea, please leave a message in the comment area. I look forward to hearing different voices.
Trade active
Bros, I wonder if you have referred to my trading strategy? The long orders I made near 3377 have all been profitable and have achieved good results. I hope the same is true for my brothers. I'm still optimistic about the long trade in gold at night, but we do not rule out the possible pullback caused by the top divergence of the 1H MACD indicator. Therefore, I choose to close the position near 3393.Related publications
Disclaimer
The information and publications are not meant to be, and do not constitute, financial, investment, trading, or other types of advice or recommendations supplied or endorsed by TradingView. Read more in the Terms of Use.
Related publications
Disclaimer
The information and publications are not meant to be, and do not constitute, financial, investment, trading, or other types of advice or recommendations supplied or endorsed by TradingView. Read more in the Terms of Use.