Currently, the price is moving sideways within a channel.
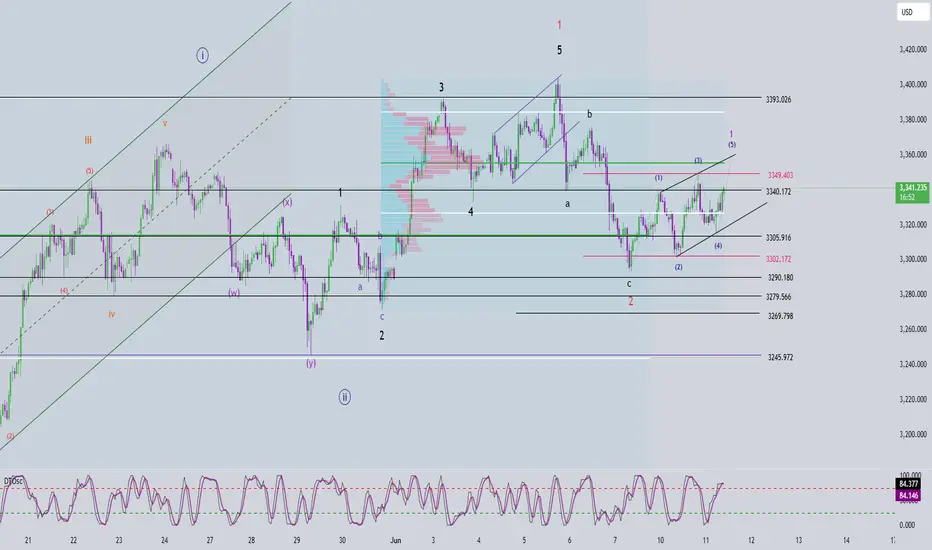
🔍 Wave Structure Analysis:
Looking closely at the wave patterns inside this price channel, we can clearly see a series of 3-wave structures developing. Previously, we also observed what appears to be an abc corrective pattern (black), which leads me to suspect that we might be forming a triangle structure as the beginning of a wave 1 sequence (12345 in green).
It seems that wave 4 has already completed, and the price is currently in wave 5. Structurally, wave 5 may take the form of a 3-wave move, and the key confirmation we want to see is a break above 3349, signaling that the top of wave 5 is in place.
☄️ Typically, once a wave 1 triangle completes, the market tends to enter a sharp and deep corrective move in the form of a zigzag.
🎯 Potential Target Zones (based on Fibonacci + Volume Profile):
Target Zone 1: 3352 – 3355
Target Zone 2: 3362 – 3365
⚡️ Momentum Outlook:
D1 Momentum: Starting to turn bullish, suggesting the current correction is nearing completion and we could see a bullish week ahead.
H4 Momentum: Currently in overbought territory – I expect the price to break above 3349, followed by a momentum reversal on H4, which could provide a great SELL opportunity at the upper targets.
H1 Momentum: Is about to turn bearish, indicating a short-term pullback may occur. If this correction fails to break below 3315, the price may be completing wave 5 as a 3-wave structure. In that case, we should wait for H1 momentum to turn bullish and then bearish again to confirm wave 5 completion.
📌 Trading Plan:
🔻 SELL Zone: 3352 – 3355
⛔️ Stop Loss: 3369
🎯 TP1: 3334
🎯 TP2: 3307
Trade active
+140 pips👉 Join the channel to receive more scalping signals!
Channel Telegram: t.me/+XkFQ95yHVOEwNDc1
Channel Telegram: t.me/+XkFQ95yHVOEwNDc1
Disclaimer
The information and publications are not meant to be, and do not constitute, financial, investment, trading, or other types of advice or recommendations supplied or endorsed by TradingView. Read more in the Terms of Use.
👉 Join the channel to receive more scalping signals!
Channel Telegram: t.me/+XkFQ95yHVOEwNDc1
Channel Telegram: t.me/+XkFQ95yHVOEwNDc1
Disclaimer
The information and publications are not meant to be, and do not constitute, financial, investment, trading, or other types of advice or recommendations supplied or endorsed by TradingView. Read more in the Terms of Use.