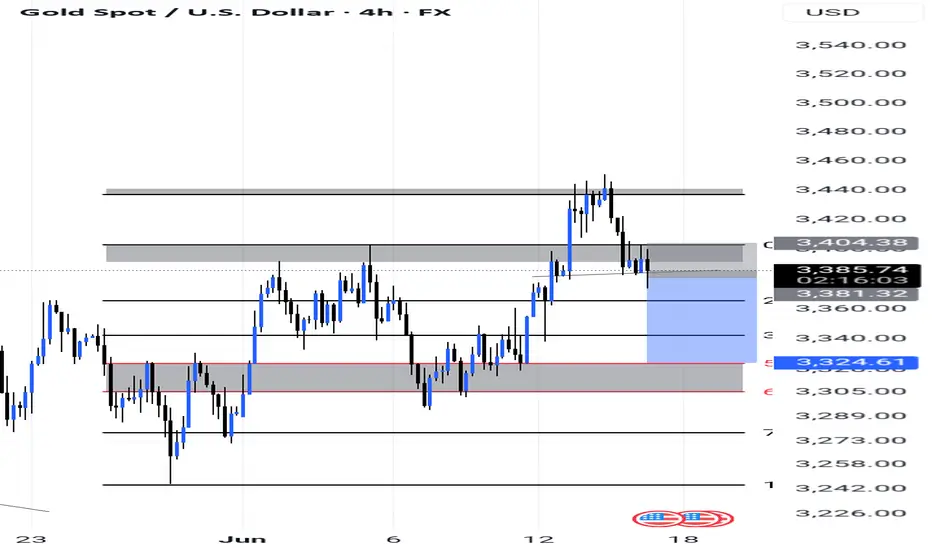
The chart suggests a bearish setup, expecting price to drop from the current resistance.
Multiple support and resistance levels are drawn to identify reaction zones.
The price recently broke below a zone and might be retesting it (potential confirmation for a sell).
Multiple support and resistance levels are drawn to identify reaction zones.
The price recently broke below a zone and might be retesting it (potential confirmation for a sell).
Disclaimer
The information and publications are not meant to be, and do not constitute, financial, investment, trading, or other types of advice or recommendations supplied or endorsed by TradingView. Read more in the Terms of Use.
Disclaimer
The information and publications are not meant to be, and do not constitute, financial, investment, trading, or other types of advice or recommendations supplied or endorsed by TradingView. Read more in the Terms of Use.