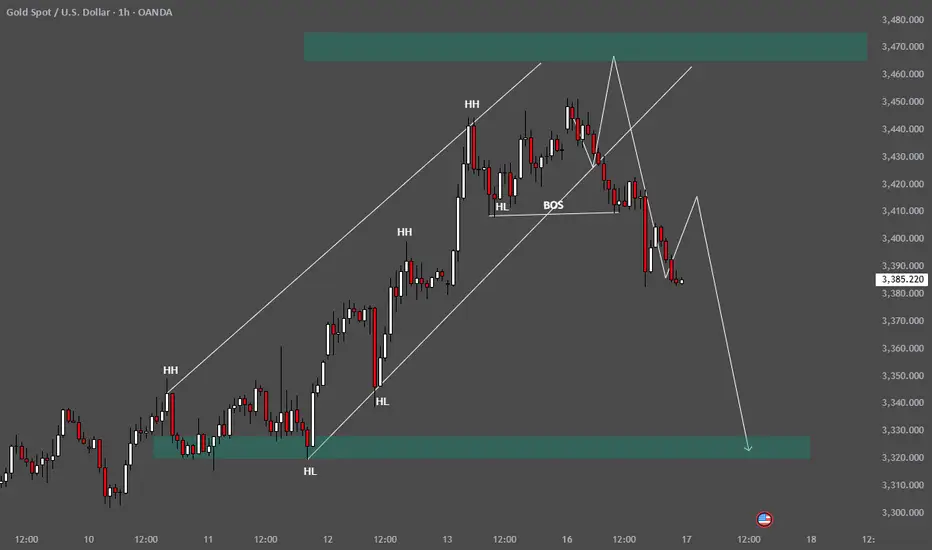
This chart captures a clear market structure transition on Gold’s 1-hour timeframe, highlighting a shift from bullish momentum to a potential bearish phase.
🔍 Key Observations:
Uptrend Structure:
Price had been respecting a bullish channel with a sequence of Higher Highs (HH) and Higher Lows (HL), showing strong bullish momentum.
Break of Structure (BOS):
The bullish market structure was invalidated when price broke below the most recent Higher Low, marking a Break of Structure (BOS). This signals the end of the uptrend and beginning of possible bearish control.
CHoCH (Change of Character):
Before the BOS, price failed to make a new HH and began forming lower highs — this internal shift hinted at weakness and can be considered the Change of Character, occurring subtly before the BOS.
Bearish Projection:
Price is expected to retest the broken structure (potential lower high formation) and continue dropping toward the demand zone (green box) around $3,330 - $3,340.
Supply Zone Above:
The upper green zone marks a supply region, from where the bearish rejection initiated, reinforcing the bearish bias.
✅ Conclusion:
This is a textbook example of a trend reversal setup:
CHoCH ➤ BOS ➤ Pullback ➤ Continuation.
Traders may watch for short opportunities after a bearish retest, with the green demand zone below as a potential take-profit area.
💰 King Maker FX — Master the Gold Market with Precision.
Unlock real-time trends, pro strategies, and expert insights to turn every move into profit. 🚀✨ t.me/kmforexllc
Unlock real-time trends, pro strategies, and expert insights to turn every move into profit. 🚀✨ t.me/kmforexllc
Related publications
Disclaimer
The information and publications are not meant to be, and do not constitute, financial, investment, trading, or other types of advice or recommendations supplied or endorsed by TradingView. Read more in the Terms of Use.