Gold (XAUUSD) has spent the last few weeks coiling within a tight consolidation range, but the wait may soon be over. The daily chart shows a textbook rectangle formation, a powerful pattern that often precedes significant trend continuation. With prices currently pushing toward the upper resistance of this range, a bullish breakout could be imminent—and potentially explosive.
Let’s dive deep into the technical setup, the potential breakout targets, and what levels traders should be watching right now.
📉 The Pattern: Channel Consolidation
Since late May 2025, gold has been trapped in a sideways structure defined by:
Resistance Zone: $3,600 – $3,620
Support Zone: $3,270 – $3,290
This structure has formed after a massive prior rally earlier in the year, making it a classic bullish continuation pattern.
Each pullback into support has been met with buying, while resistance has repeatedly held—but now momentum is building.
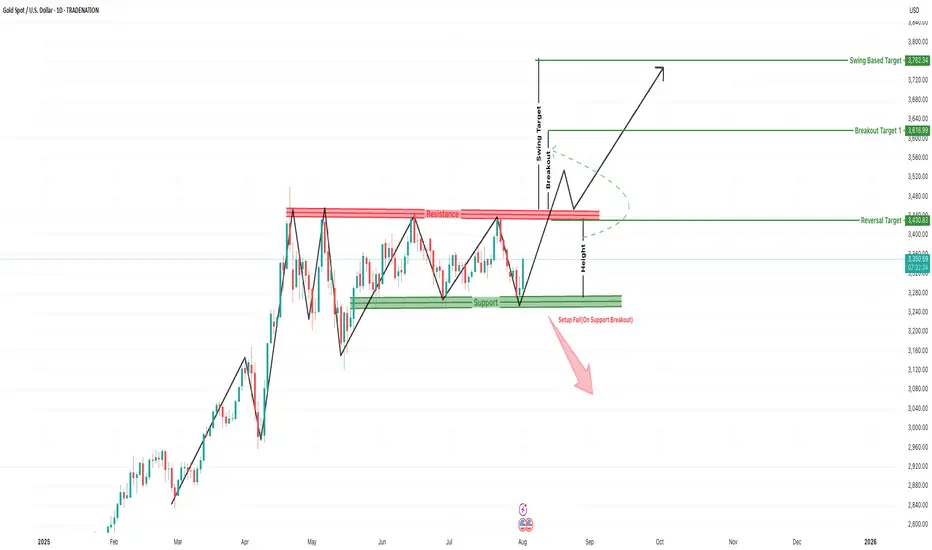
Technically, this consolidation has validated itself with multiple swing points at both the upper and lower boundaries. The pattern is clean, well-respected, and supported by repeated reactions at both support and resistance levels. If the price breaks and sustains above the $3,620 resistance area, the pattern will be considered complete, signaling continuation of the prior bullish trend. While volume analysis isn't included in the chart, typically such breakouts are supported by increased participation, which can offer added confirmation.
If a breakout occurs, traders can target multiple price levels based on the height of the rectangle added to the breakout point. The first logical target would be around $3,616, followed by a swing-based target at $3,762. These levels are based on technical projection methods using the measured move technique. Importantly, price has already reached a reversal confirmation target around $3,430, which further validates bullish strength.
However, no setup is complete without acknowledging the risks. If gold fails to sustain the recent rally and instead breaks below $3,280 support, the current setup would be invalidated. This would shift the outlook to bearish and could push prices toward $3,200, $3,120, and possibly even lower toward the psychological support at $3,000.
From a trading perspective, the ideal bullish entry would be on a daily candle close above $3,620 or on a retest of the breakout zone with strong buying confirmation. A protective stop loss can be placed below the breakout candle or around the $3,550 area. Initial targets remain $3,616 and $3,762. In the bearish case, a breakdown below $3,280 would be a cue for shorting opportunities with stops above $3,300 and downside targets at $3,200 and $3,120.
In summary, gold is at a critical point on the chart. The current structure suggests a potential breakout is coming, and traders should be ready to act based on confirmed moves beyond key levels. Whether this pattern leads to a strong bullish continuation or a failed setup, the movement is expected to be sharp and potentially rewarding. This is a high-probability setup worth watching closely in the coming days.
=================================================================
Disclosure: I am part of Trade Nation's Influencer program and receive a monthly fee for using their TradingView charts in my analysis.
=================================================================
Let’s dive deep into the technical setup, the potential breakout targets, and what levels traders should be watching right now.
📉 The Pattern: Channel Consolidation
Since late May 2025, gold has been trapped in a sideways structure defined by:
Resistance Zone: $3,600 – $3,620
Support Zone: $3,270 – $3,290
This structure has formed after a massive prior rally earlier in the year, making it a classic bullish continuation pattern.
Each pullback into support has been met with buying, while resistance has repeatedly held—but now momentum is building.
Technically, this consolidation has validated itself with multiple swing points at both the upper and lower boundaries. The pattern is clean, well-respected, and supported by repeated reactions at both support and resistance levels. If the price breaks and sustains above the $3,620 resistance area, the pattern will be considered complete, signaling continuation of the prior bullish trend. While volume analysis isn't included in the chart, typically such breakouts are supported by increased participation, which can offer added confirmation.
If a breakout occurs, traders can target multiple price levels based on the height of the rectangle added to the breakout point. The first logical target would be around $3,616, followed by a swing-based target at $3,762. These levels are based on technical projection methods using the measured move technique. Importantly, price has already reached a reversal confirmation target around $3,430, which further validates bullish strength.
However, no setup is complete without acknowledging the risks. If gold fails to sustain the recent rally and instead breaks below $3,280 support, the current setup would be invalidated. This would shift the outlook to bearish and could push prices toward $3,200, $3,120, and possibly even lower toward the psychological support at $3,000.
From a trading perspective, the ideal bullish entry would be on a daily candle close above $3,620 or on a retest of the breakout zone with strong buying confirmation. A protective stop loss can be placed below the breakout candle or around the $3,550 area. Initial targets remain $3,616 and $3,762. In the bearish case, a breakdown below $3,280 would be a cue for shorting opportunities with stops above $3,300 and downside targets at $3,200 and $3,120.
In summary, gold is at a critical point on the chart. The current structure suggests a potential breakout is coming, and traders should be ready to act based on confirmed moves beyond key levels. Whether this pattern leads to a strong bullish continuation or a failed setup, the movement is expected to be sharp and potentially rewarding. This is a high-probability setup worth watching closely in the coming days.
=================================================================
Disclosure: I am part of Trade Nation's Influencer program and receive a monthly fee for using their TradingView charts in my analysis.
=================================================================
📈 Trade Smarter with TradZoo!
📣 Telegram: t.me/tradzooIndex
📣 Forex Telegram: t.me/tradzoofx
📲 Mobile App: tradzoo.com/download
📲 Forex App:tradzoo.com/forex/download
🔗 Website: bit.ly/tradzoopage
📣 Telegram: t.me/tradzooIndex
📣 Forex Telegram: t.me/tradzoofx
📲 Mobile App: tradzoo.com/download
📲 Forex App:tradzoo.com/forex/download
🔗 Website: bit.ly/tradzoopage
Disclaimer
The information and publications are not meant to be, and do not constitute, financial, investment, trading, or other types of advice or recommendations supplied or endorsed by TradingView. Read more in the Terms of Use.