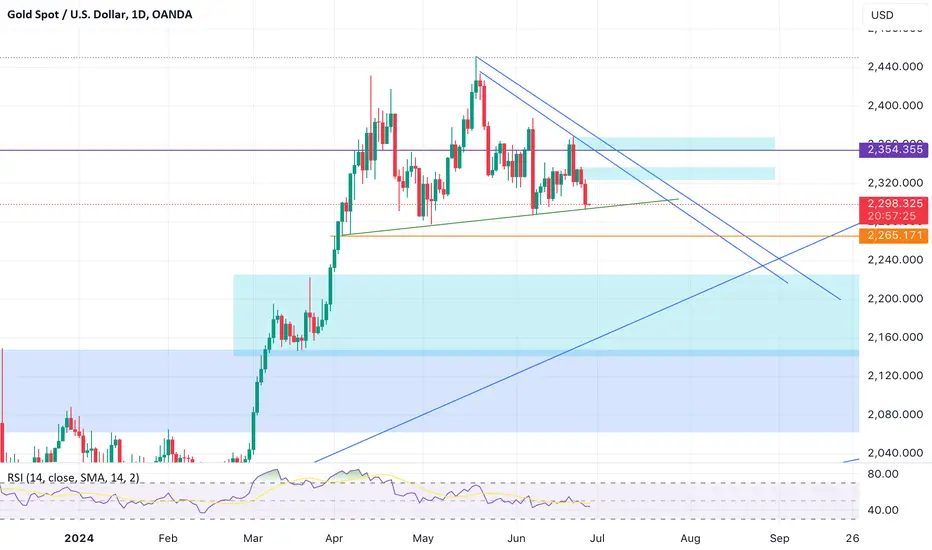
The 4-hour chart shows XAU/USD has fallen below all its moving averages, while a firmly bearish 20 SMA crossed below a flat 100 SMA, usually a sign of persistent selling interest. At the same time, the Momentum indicator turned south after failing to overcome its midline, maintaining a clear downward slope. Finally, the Relative Strength Index (RSI) indicator accelerated south, now hovering around 30 with no signs of changing course.
Support levels: 2,293.50 2,279.60 2,265.60
Resistance levels: 2,316.60 2,329.50 2,337.00
Support levels: 2,293.50 2,279.60 2,265.60
Resistance levels: 2,316.60 2,329.50 2,337.00
Disclaimer
The information and publications are not meant to be, and do not constitute, financial, investment, trading, or other types of advice or recommendations supplied or endorsed by TradingView. Read more in the Terms of Use.
Disclaimer
The information and publications are not meant to be, and do not constitute, financial, investment, trading, or other types of advice or recommendations supplied or endorsed by TradingView. Read more in the Terms of Use.
