Dear Traders,
On the 1-hour timeframe for XAUUSD (Gold Spot vs. USD):
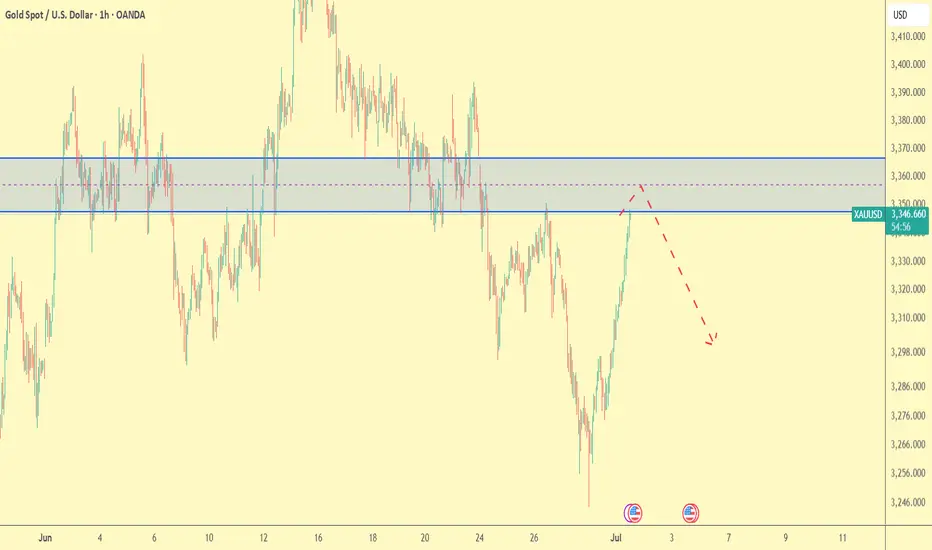
✅ The price has made a strong bullish move and is now testing a key resistance zone between 3345 and 3360. This zone has acted as both support and resistance in the past, making it a strong area of interest.
📉 We can observe upper wicks forming on the candles, suggesting buying pressure is weakening. The red dashed line on the chart indicates a potential bearish reversal scenario.
🔻 If the price fails to break and close above this resistance with strength, we could see a correction toward the 3290 to 3260 zone.
💡 Unless the price breaks above 3360 and closes strongly, long positions carry higher risk at the moment.
On the 1-hour timeframe for XAUUSD (Gold Spot vs. USD):
✅ The price has made a strong bullish move and is now testing a key resistance zone between 3345 and 3360. This zone has acted as both support and resistance in the past, making it a strong area of interest.
📉 We can observe upper wicks forming on the candles, suggesting buying pressure is weakening. The red dashed line on the chart indicates a potential bearish reversal scenario.
🔻 If the price fails to break and close above this resistance with strength, we could see a correction toward the 3290 to 3260 zone.
💡 Unless the price breaks above 3360 and closes strongly, long positions carry higher risk at the moment.
💰MY FREE FOREX CRYPTO SIGNALS TELEGRAM CHANNEL: : t.me/Alirezaktrade
Disclaimer
The information and publications are not meant to be, and do not constitute, financial, investment, trading, or other types of advice or recommendations supplied or endorsed by TradingView. Read more in the Terms of Use.