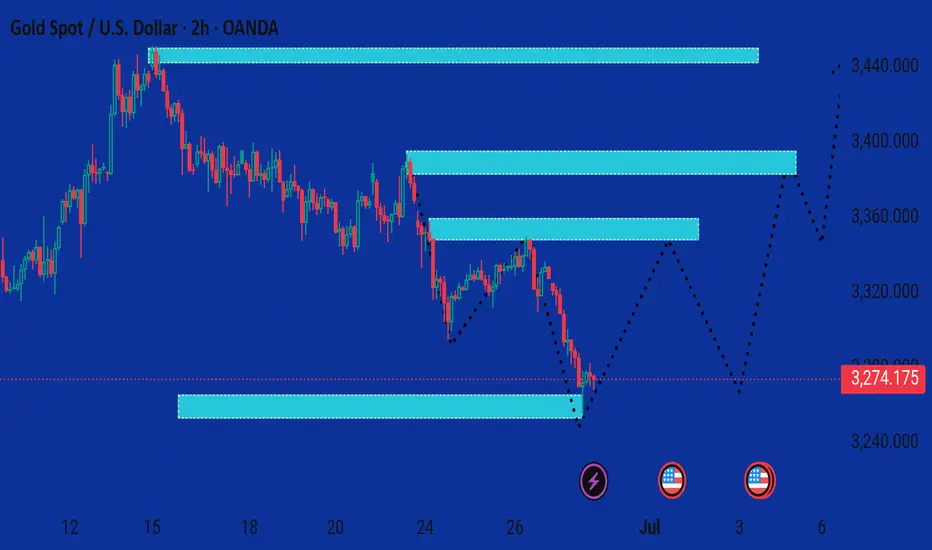
This chart illustrates a potential bullish reversal setup for Gold Spot (XAU/USD) on the 2-hour timeframe. Here’s a breakdown of the analysis:
---
🟦 Key Observations:
1. Current Price: $3,274.175 — down by 1.61%, indicating a recent bearish move.
2. Support Zone: Price has entered and reacted from a major demand zone (light blue box near 3,250), suggesting buying interest.
3. Projected Price Path (black dotted lines):
Initial bounce toward the first resistance around 3,320.
A pullback may occur, potentially retesting lower support before resuming upward movement.
Price is expected to climb toward higher supply zones at:
3,360
3,400
3,440
4. Bullish Reaction Icon (⚡️): Marks a potential reversal or liquidity grab before a bullish impulse.
5. News Event Icons (🇺🇸): U.S. economic data releases are anticipated near July 2–4, which could trigger volatility and confirm the direction.
---
📈 Outlook Summary:
Bias: Bullish (short to mid-term)
Key Levels to Watch:
Support: 3,250 – 3,270 zone
Targets: 3,320 → 3,360 → 3,400 → 3,440
Invalidation: A clean break and close below 3,240 would challenge the bullish outlook.
Let me know if you’d like a breakdown of entry/exit strategies or risk management tips based on this setup.
---
🟦 Key Observations:
1. Current Price: $3,274.175 — down by 1.61%, indicating a recent bearish move.
2. Support Zone: Price has entered and reacted from a major demand zone (light blue box near 3,250), suggesting buying interest.
3. Projected Price Path (black dotted lines):
Initial bounce toward the first resistance around 3,320.
A pullback may occur, potentially retesting lower support before resuming upward movement.
Price is expected to climb toward higher supply zones at:
3,360
3,400
3,440
4. Bullish Reaction Icon (⚡️): Marks a potential reversal or liquidity grab before a bullish impulse.
5. News Event Icons (🇺🇸): U.S. economic data releases are anticipated near July 2–4, which could trigger volatility and confirm the direction.
---
📈 Outlook Summary:
Bias: Bullish (short to mid-term)
Key Levels to Watch:
Support: 3,250 – 3,270 zone
Targets: 3,320 → 3,360 → 3,400 → 3,440
Invalidation: A clean break and close below 3,240 would challenge the bullish outlook.
Let me know if you’d like a breakdown of entry/exit strategies or risk management tips based on this setup.
t.me/+EQ88IkMSUvQwMGJk
Join telegram channel free
t.me/+EQ88IkMSUvQwMGJk
Join telegram channel free
t.me/+EQ88IkMSUvQwMGJk
Disclaimer
The information and publications are not meant to be, and do not constitute, financial, investment, trading, or other types of advice or recommendations supplied or endorsed by TradingView. Read more in the Terms of Use.
t.me/+EQ88IkMSUvQwMGJk
Join telegram channel free
t.me/+EQ88IkMSUvQwMGJk
Join telegram channel free
t.me/+EQ88IkMSUvQwMGJk
Disclaimer
The information and publications are not meant to be, and do not constitute, financial, investment, trading, or other types of advice or recommendations supplied or endorsed by TradingView. Read more in the Terms of Use.