📆 Big Picture View
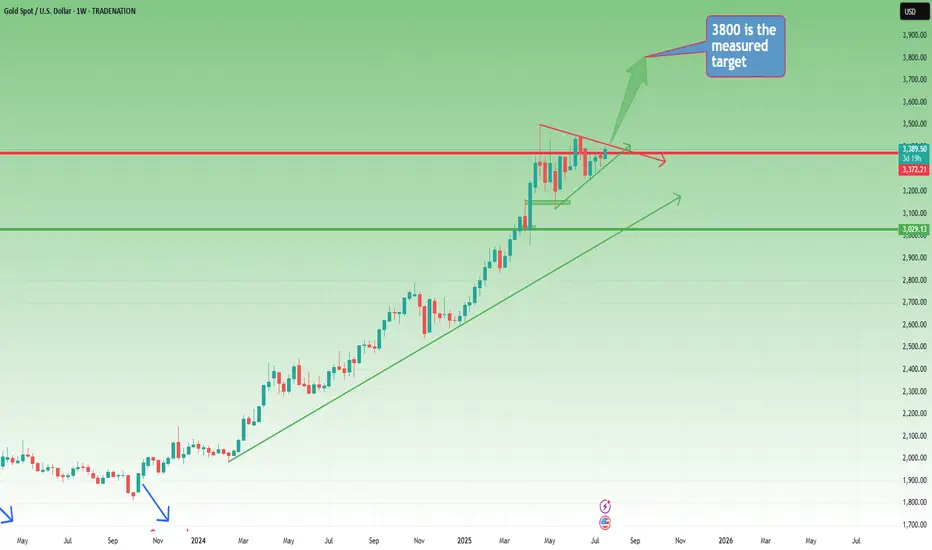
Since the start of 2024, Gold has been moving in a well-defined long-term bullish trend.
Yes, there were meaningful pullbacks along the way — but the direction was never in doubt. Step by step, Gold climbed over 15,000 pips in just over a year, reaching a new all-time high in late April.
📉 Post-ATH: A Period of Stabilization
After peaking, Gold shifted into consolidation mode, with price gravitating around the 3300 zone.
This sideways movement has been ongoing for the past three months, but it’s not a sign of weakness — it’s the market catching its breath.
On the weekly chart, this consolidation is now forming a symmetrical triangle, a classic continuation pattern that often appears mid-trend.
📐 The Technical Setup
- The symmetrical triangle shows compression of volatility
- Buyers and sellers are slowly converging toward a decision point
- A breakout is approaching, and when it comes, it could be explosive
🎯 What’s the Trigger?
- A confirmed break above 3450 would validate the triangle breakout
- That opens the door to quickly test the 3500 round figure
- The measured target for the triangle sits at 3800
Given the time Gold has spent consolidating (3+ months), this target could realistically be reached by year’s end
🧭 Strategic Takeaway
- As long as Gold holds above 3300, the bullish structure remains valid
- Breakout above 3450 is the green light for the next leg up
- Until then, the consolidation continues, and smart money prepares
📌 Conclusion:
Gold is building pressure. The weekly triangle is maturing.
This isn’t the end — it’s the pause before the next move.
Stay patient. Stay focused.
Because if 3450 breaks… 3800 is not a dream — it’s a destination. 🚀
Disclosure: I am part of TradeNation's Influencer program and receive a monthly fee for using their TradingView charts in my analyses and educational articles.
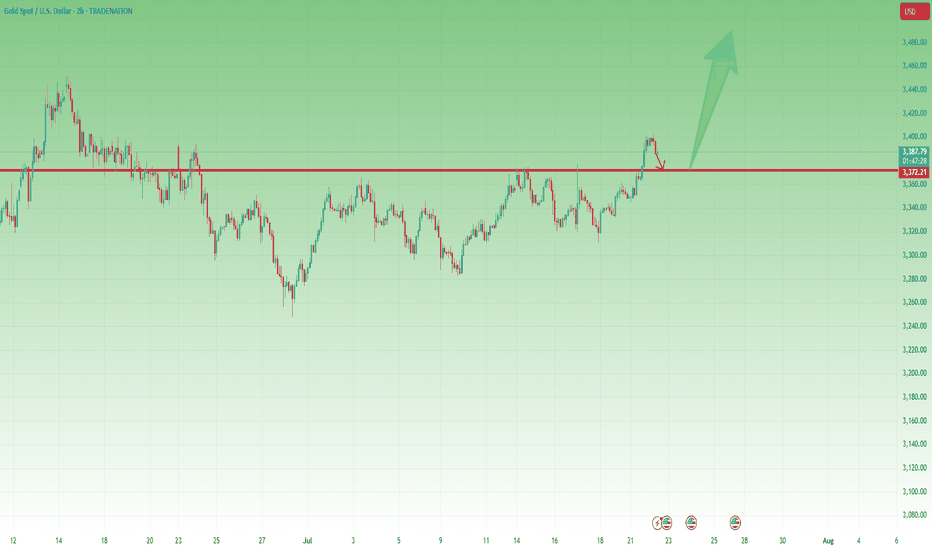
P.S: Here you have a short term analysis on Gold
Since the start of 2024, Gold has been moving in a well-defined long-term bullish trend.
Yes, there were meaningful pullbacks along the way — but the direction was never in doubt. Step by step, Gold climbed over 15,000 pips in just over a year, reaching a new all-time high in late April.
📉 Post-ATH: A Period of Stabilization
After peaking, Gold shifted into consolidation mode, with price gravitating around the 3300 zone.
This sideways movement has been ongoing for the past three months, but it’s not a sign of weakness — it’s the market catching its breath.
On the weekly chart, this consolidation is now forming a symmetrical triangle, a classic continuation pattern that often appears mid-trend.
📐 The Technical Setup
- The symmetrical triangle shows compression of volatility
- Buyers and sellers are slowly converging toward a decision point
- A breakout is approaching, and when it comes, it could be explosive
🎯 What’s the Trigger?
- A confirmed break above 3450 would validate the triangle breakout
- That opens the door to quickly test the 3500 round figure
- The measured target for the triangle sits at 3800
Given the time Gold has spent consolidating (3+ months), this target could realistically be reached by year’s end
🧭 Strategic Takeaway
- As long as Gold holds above 3300, the bullish structure remains valid
- Breakout above 3450 is the green light for the next leg up
- Until then, the consolidation continues, and smart money prepares
📌 Conclusion:
Gold is building pressure. The weekly triangle is maturing.
This isn’t the end — it’s the pause before the next move.
Stay patient. Stay focused.
Because if 3450 breaks… 3800 is not a dream — it’s a destination. 🚀
Disclosure: I am part of TradeNation's Influencer program and receive a monthly fee for using their TradingView charts in my analyses and educational articles.
P.S: Here you have a short term analysis on Gold
📈 Forex & XAU/USD Channel:
t.me/intradaytradingsignals
💎 Crypto Channel:
t.me/FanCryptocurrency
Related publications
Disclaimer
The information and publications are not meant to be, and do not constitute, financial, investment, trading, or other types of advice or recommendations supplied or endorsed by TradingView. Read more in the Terms of Use.