⏳ Overview
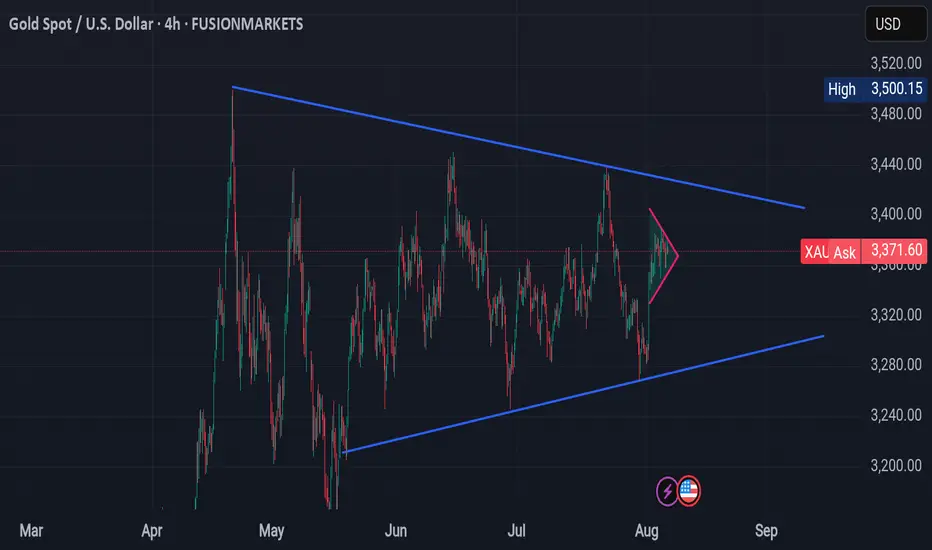
This 4-hour chart of XAU/USD (Gold vs USD) shows a large symmetrical triangle pattern with a smaller triangle forming near the apex — signaling an upcoming high-probability breakout. This structure reflects prolonged market indecision and compression of volatility.
---
🔺 1. Chart Pattern Structure
🟦 Primary Structure: Symmetrical Triangle
Upper Trendline (Resistance): Descending from ~3,480 to ~3,400
Lower Trendline (Support): Ascending from ~3,200 to ~3,300
This large triangle encapsulates price action since April 2025, representing an extended consolidation phase.
🟥 Secondary Structure: Mini Triangle
A smaller triangle (highlighted in pink) within the larger structure shows tight range consolidation in the last 2–3 weeks.
This acts as a coiling zone, where a breakout is imminent.
---
📈 2. Price Action Analysis
Current Price: $3,374.26 (midpoint of the large triangle)
Volatility: Significantly reduced, suggesting a breakout move is coming.
Market Condition: Low momentum and choppy within the range — likely liquidity build-up by institutions.
---
🎯 3. Key Levels
Zone Price Range Significance
Immediate Resistance $3,400–$3,420(Local top of triangle)
Immediate Support $3,300–$3,320(Bottom triangle support)
Major Breakout Level 🔼 Above $3,420(Bullish breakout)
Major Breakdown Level 🔽 Below $3,280 (Bearish breakdown)
High Target Zone $3,500–$3,560(Measured bullish move)
Low Target Zone $3,200–$3,140(Measured bearish move)
---
🧭 4. Trade Setup Scenarios
✅ Bullish Scenario (Breakout Above $3,420)
Entry: Above $3,420
Stop-Loss: Below $3,390
Targets:
TP1: $3,500
TP2: $3,560
⚠️ Bearish Scenario (Breakdown Below $3,280)
Entry: Below $3,280
Stop-Loss: Above $3,310
Targets:
TP1: $3,200
TP2: $3,140
---
📉 5. Institutional Perspective
This pattern may represent distribution (if it breaks down) or re-accumulation (if it breaks up).
Institutions often use triangle apexes as breakout points to trigger stop hunts and induce volatility.
---
📝 Professional Conclusion
> Gold (XAU/USD) is in a well-defined symmetrical triangle, with price action approaching a critical breakout zone. The market is coiling within a smaller triangle, suggesting a volatility explosion is near. Traders should stay out of the chop zone and prepare for a breakout or breakdown confirmation using volume, candlestick structure, or retest setups.
---
Would you like me to:
🔧 Mark this chart with entry/exit levels, stop loss, and breakout targets?
📤 Prepare a version suitable for posting on TradingView with annotations and analysis title?
Disclaimer
The information and publications are not meant to be, and do not constitute, financial, investment, trading, or other types of advice or recommendations supplied or endorsed by TradingView. Read more in the Terms of Use.
Disclaimer
The information and publications are not meant to be, and do not constitute, financial, investment, trading, or other types of advice or recommendations supplied or endorsed by TradingView. Read more in the Terms of Use.