Chart Analysis Breakdown
:
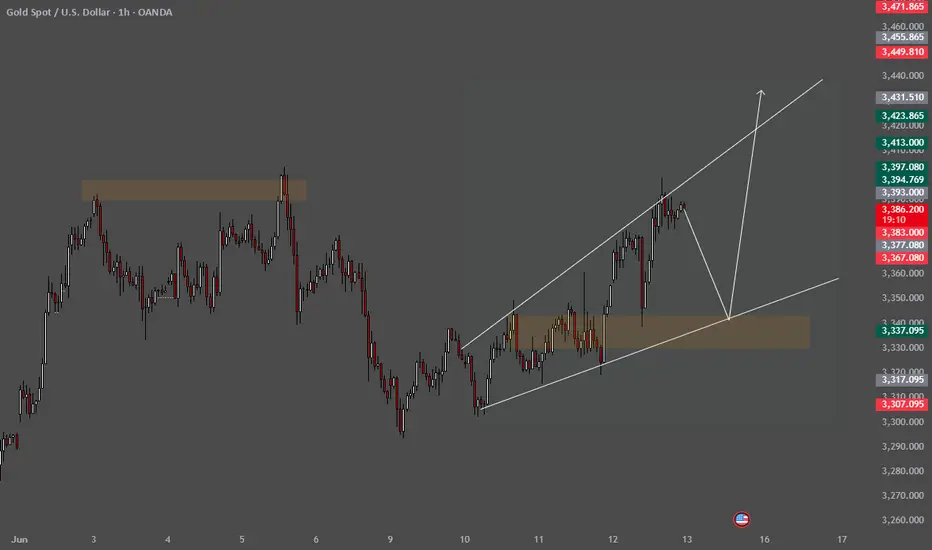
Price Channel (Ascending):
A rising wedge or ascending channel is drawn, showing higher highs and higher lows.
The upper and lower white trendlines are converging slightly, suggesting a potential breakout or breakdown soon.
Key Support and Resistance Zones:
Orange Resistance Zone (Top Left): Marked as a supply zone where price previously reversed (around 3,420–3,430).
Orange Support Zone (Bottom Center): Around 3,320–3,330, possibly acting as demand or a retest area.
Price Levels (Right Scale):
Current price is around 3,386.36.
Several price markers are noted (green for potential bullish targets, red for bearish zones).
Projections/Scenarios (White Arrows):
Bullish Scenario: Price breaks above the upper channel line and targets levels like 3,423 or 3,440.
Bearish Scenario: Price fails at resistance, retraces back to the support zone, possibly to 3,360 or lower (near 3,320 zone).
EMA 50 (Blue Line):
An EMA (Exponential Moving Average) is lightly visible and used for trend confirmation. Price is currently above it, indicating bullish bias.
Other Chart Elements:
Time shown is UTC+3.
The local weather is 30°C and hazy.
Timestamp: June 13, 2025, at 1:35 AM.
📈 Interpretation:
The chart suggests a watch for breakout scenario in XAUUSD:
If price sustains above the rising channel, it could rally further.
If it breaks below, look for a retest of the 3,320–3,330 zone.
:
Price Channel (Ascending):
A rising wedge or ascending channel is drawn, showing higher highs and higher lows.
The upper and lower white trendlines are converging slightly, suggesting a potential breakout or breakdown soon.
Key Support and Resistance Zones:
Orange Resistance Zone (Top Left): Marked as a supply zone where price previously reversed (around 3,420–3,430).
Orange Support Zone (Bottom Center): Around 3,320–3,330, possibly acting as demand or a retest area.
Price Levels (Right Scale):
Current price is around 3,386.36.
Several price markers are noted (green for potential bullish targets, red for bearish zones).
Projections/Scenarios (White Arrows):
Bullish Scenario: Price breaks above the upper channel line and targets levels like 3,423 or 3,440.
Bearish Scenario: Price fails at resistance, retraces back to the support zone, possibly to 3,360 or lower (near 3,320 zone).
EMA 50 (Blue Line):
An EMA (Exponential Moving Average) is lightly visible and used for trend confirmation. Price is currently above it, indicating bullish bias.
Other Chart Elements:
Time shown is UTC+3.
The local weather is 30°C and hazy.
Timestamp: June 13, 2025, at 1:35 AM.
📈 Interpretation:
The chart suggests a watch for breakout scenario in XAUUSD:
If price sustains above the rising channel, it could rally further.
If it breaks below, look for a retest of the 3,320–3,330 zone.
Trade closed: target reached
Target Reached.💰 King Maker FX — Master the Gold Market with Precision.
Unlock real-time trends, pro strategies, and expert insights to turn every move into profit. 🚀✨ t.me/kmforexllc
Unlock real-time trends, pro strategies, and expert insights to turn every move into profit. 🚀✨ t.me/kmforexllc
Disclaimer
The information and publications are not meant to be, and do not constitute, financial, investment, trading, or other types of advice or recommendations supplied or endorsed by TradingView. Read more in the Terms of Use.
💰 King Maker FX — Master the Gold Market with Precision.
Unlock real-time trends, pro strategies, and expert insights to turn every move into profit. 🚀✨ t.me/kmforexllc
Unlock real-time trends, pro strategies, and expert insights to turn every move into profit. 🚀✨ t.me/kmforexllc
Disclaimer
The information and publications are not meant to be, and do not constitute, financial, investment, trading, or other types of advice or recommendations supplied or endorsed by TradingView. Read more in the Terms of Use.