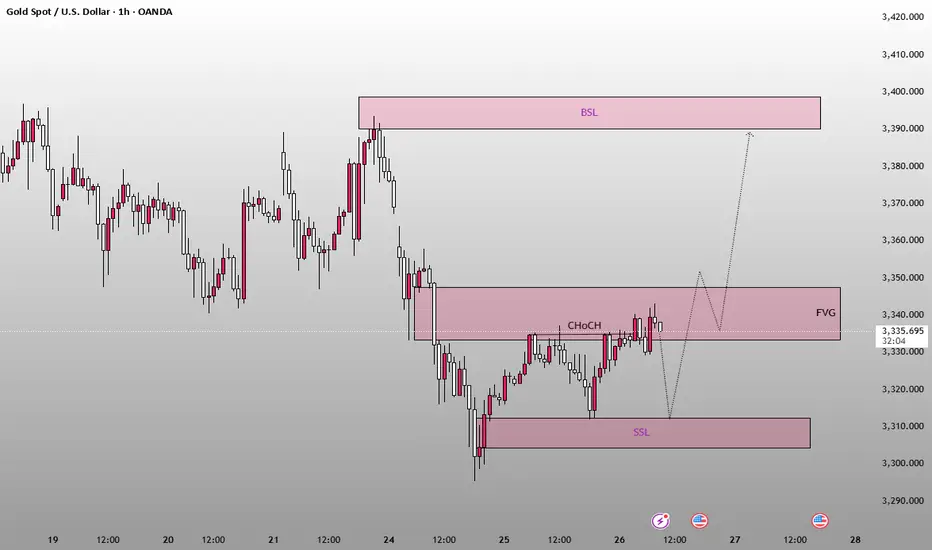
This is a 1-hour candlestick chart for Gold Spot (XAU/USD) . The chart includes various Smart Money Concepts (SMC) annotations used by traders to anticipate price movements. Here's a breakdown of the key elements and what they suggest:
---
### **Key Annotations & Zones:**
1. **CHoCH (Change of Character)**
* Located near the center of the chart around the 3,335–3,340 zone.
* Indicates a potential trend reversal from bearish to bullish.
2. **FVG (Fair Value Gap)**
* Same region as the CHoCH zone (3,335–3,345).
* A price imbalance where price might revisit before continuing upward.
3. **SSL (Sell-side Liquidity)**
* Highlighted below the current price (around 3,310).
* Denotes liquidity below a previous low where stop-losses from long positions may reside.
* Price could dip here to grab liquidity before heading higher.
4. **BSL (Buy-side Liquidity)**
* Marked near the top (around 3,395–3,400).
* A target area where stop-losses from short positions or breakout buy orders may reside.
---
### **Price Forecast Path (Dashed Arrows):**
* The forecast suggests a **short-term dip** into the **SSL zone**.
* Followed by a **strong bullish move**, possibly triggered after a liquidity sweep.
* The price is expected to return to the **FVG zone**, consolidate, and then push up toward the **BSL zone** at \~3,400.
---
### **Overall Interpretation:**
This chart suggests a bullish bias in the medium term. The trader anticipates:
* A brief decline to gather sell-side liquidity.
* A rally fueled by a CHoCH and FVG retest.
* An ultimate aim to target buy-side liquidity above the recent highs.
---
### **Key Annotations & Zones:**
1. **CHoCH (Change of Character)**
* Located near the center of the chart around the 3,335–3,340 zone.
* Indicates a potential trend reversal from bearish to bullish.
2. **FVG (Fair Value Gap)**
* Same region as the CHoCH zone (3,335–3,345).
* A price imbalance where price might revisit before continuing upward.
3. **SSL (Sell-side Liquidity)**
* Highlighted below the current price (around 3,310).
* Denotes liquidity below a previous low where stop-losses from long positions may reside.
* Price could dip here to grab liquidity before heading higher.
4. **BSL (Buy-side Liquidity)**
* Marked near the top (around 3,395–3,400).
* A target area where stop-losses from short positions or breakout buy orders may reside.
---
### **Price Forecast Path (Dashed Arrows):**
* The forecast suggests a **short-term dip** into the **SSL zone**.
* Followed by a **strong bullish move**, possibly triggered after a liquidity sweep.
* The price is expected to return to the **FVG zone**, consolidate, and then push up toward the **BSL zone** at \~3,400.
---
### **Overall Interpretation:**
This chart suggests a bullish bias in the medium term. The trader anticipates:
* A brief decline to gather sell-side liquidity.
* A rally fueled by a CHoCH and FVG retest.
* An ultimate aim to target buy-side liquidity above the recent highs.
💰 Making Millions with Mariam_Oliver 💰
🔥 6+ Years of Mastery in Forex Trading
✅ 100% Precision Signals – Trusted by Thousands
🚀 Real Results. Real Profits. Real Fast.
👑 Learn from the Best. Trade like the Rest Can't.
#HabibiLetMakeMili 💵
🔥 6+ Years of Mastery in Forex Trading
✅ 100% Precision Signals – Trusted by Thousands
🚀 Real Results. Real Profits. Real Fast.
👑 Learn from the Best. Trade like the Rest Can't.
#HabibiLetMakeMili 💵
Disclaimer
The information and publications are not meant to be, and do not constitute, financial, investment, trading, or other types of advice or recommendations supplied or endorsed by TradingView. Read more in the Terms of Use.