📊 Gold (XAUUSD) Analysis – 1H Timeframe
This chart outlines key market structure levels with two possible scenarios:
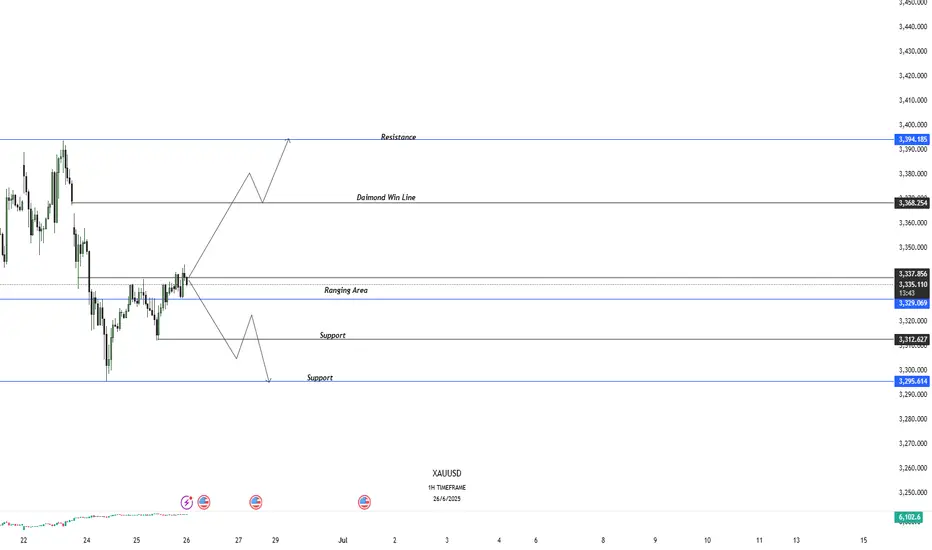
🔹 Ranging Area between 3329 – 3337 is being tested.
🔹 A break above the Diamond Win Line (3368) could lead to a bullish continuation toward the major resistance at 3394.
🔹 On the downside, rejection from this zone may push price back toward the support levels at 3312 and 3295.
🔹 Watch for clean price action confirmation before entering trades.
This setup is based on price structure, clean market zones, and potential breakout/rejection scenarios. Stay patient and trade smart!
This chart outlines key market structure levels with two possible scenarios:
🔹 Ranging Area between 3329 – 3337 is being tested.
🔹 A break above the Diamond Win Line (3368) could lead to a bullish continuation toward the major resistance at 3394.
🔹 On the downside, rejection from this zone may push price back toward the support levels at 3312 and 3295.
🔹 Watch for clean price action confirmation before entering trades.
This setup is based on price structure, clean market zones, and potential breakout/rejection scenarios. Stay patient and trade smart!
Trade active
Disclaimer
The information and publications are not meant to be, and do not constitute, financial, investment, trading, or other types of advice or recommendations supplied or endorsed by TradingView. Read more in the Terms of Use.
Disclaimer
The information and publications are not meant to be, and do not constitute, financial, investment, trading, or other types of advice or recommendations supplied or endorsed by TradingView. Read more in the Terms of Use.