### 🧭 **Chart Overview**
* **Timeframe**: 1H (1 Hour)
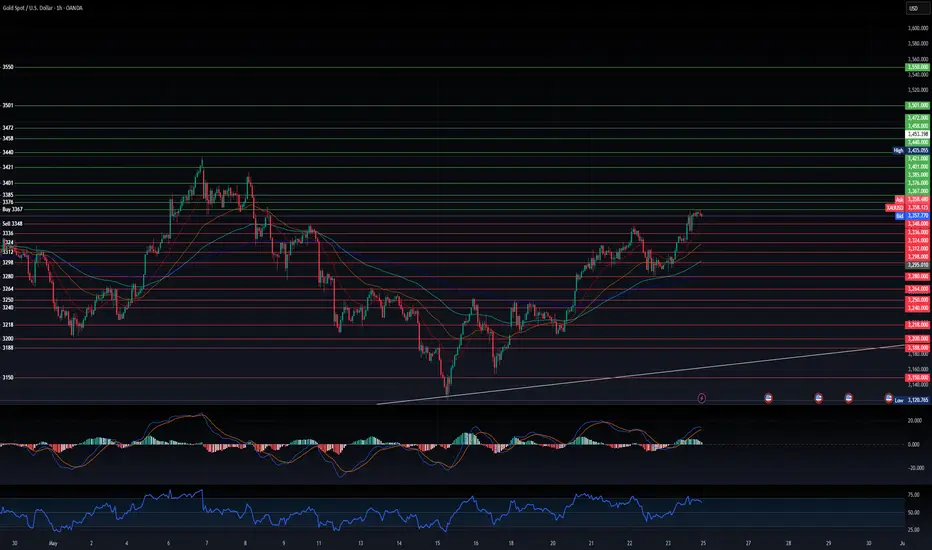
* **Platform**: TradingView (OANDA feed)
* **Indicators**:
* **Moving Averages** (likely EMA or SMA, 5/10/20/50/100/200)
* **MACD**
* **RSI**
* **Buy Zones (Green Lines)**: Upper areas
* **Sell Zones (Red Lines)**: Lower areas
* **Price at time of analysis**: \~\$3,364
---
### 🔍 **Technical Indicator Analysis**
#### 📉 **MACD**
* **Current Status**: Bullish momentum present.
* MACD line is above signal line, showing upward pressure.
* Histogram is slightly weakening, signaling **momentum may be slowing**, but no bearish crossover yet.
#### 📊 **RSI**
* RSI \~66–70, approaching overbought territory.
* Indicates **strong bullish strength**, but **potential for short-term pullback**.
#### 📈 **Moving Averages**
* Price is above all key MAs (short to long-term).
* **MA stack is aligned bullishly** (short above long), indicating trend continuation bias.
* Especially price above 200MA — strong bullish confirmation.
---
### 🧱 **Key Technical Zones**
#### 🔼 **Buy Zones (Green Lines)**
* Ranging from **\~3367 to \~3501**.
* Current price is testing **3367** — a key **resistance-turned-potential-entry**.
* If price breaks and closes above **3367**, watch for:
* **3410**, **3445**, and **3480–3501** targets.
* Strong momentum continuation with little resistance above.
#### 🔽 **Sell Zones (Red Lines)**
* Stacked from **\~3360 down to 3188**.
* Minor intraday support forming at **3340–3324** (watch these for scalping/pullbacks).
* Breakdown below **3320** could initiate deeper pullback to:
* **3280**, **3240**, **3218**, then **3188**.
---
### 📌 **Current Market Structure**
* **Higher Highs and Higher Lows** forming since \~May 13th.
* Uptrend confirmed on H1.
* Price respected trendline support around **May 15–20**.
* MACD + RSI + MA alignment all confirm bullish bias.
---
### 🧠 **My 20-Year Trader Insight**
#### 🟢 **Buy Bias IF**:
* Clean break and retest of **3367**, then ride to **3410 → 3445**.
* Scalpers could nibble at **3340–3320** dips if RSI cools.
#### 🔴 **Sell Setup ONLY IF**:
* Strong bearish divergence shows on RSI + MACD crossover.
* Breakdown below **3320** confirms shift in short-term sentiment.
* Use **3367** as invalidation for shorts — don’t fight momentum unnecessarily.
---
### 🔁 **Trade Plan Suggestion**
| Strategy | Entry | SL | TP |
| ---------------- | ---------------------------- | ---------- | --------------------------- |
| 🔼 Buy Breakout | 3370 (confirmed close above) | 3340 | 3410 → 3445 |
| 🔄 Buy Pullback | 3324–3340 zone | Below 3300 | 3360 → 3370 |
| 🔽 Sell Reversal | Below 3320 | 3367 | 3280 → 3240 (partial), 3218 |
---
### ⚠️ Final Thoughts
* **Trend is bullish**, but nearing exhaustion short-term.
* Wait for **confirmation** at 3367 breakout OR healthy pullback to reload long.
* Avoid premature shorting unless multiple bearish confirmations appear.
Disclaimer
The information and publications are not meant to be, and do not constitute, financial, investment, trading, or other types of advice or recommendations supplied or endorsed by TradingView. Read more in the Terms of Use.
Disclaimer
The information and publications are not meant to be, and do not constitute, financial, investment, trading, or other types of advice or recommendations supplied or endorsed by TradingView. Read more in the Terms of Use.