Dear traders,
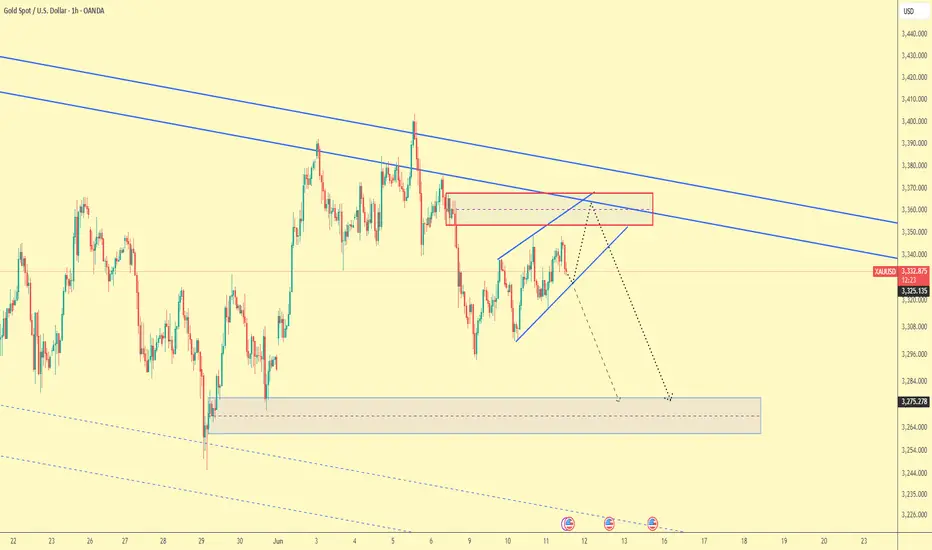
Gold (XAUUSD) is forming a rising wedge pattern on the 1-hour chart, with price approaching the key resistance zone between 3360–3362, which also aligns with the long-term descending trendline.
This confluence increases the probability of a bearish reaction from this area.
If the price fails to break above this resistance zone, a sharp drop toward the demand zone between 3275–3260 can be expected.
A confirmed breakdown of the wedge pattern would provide a valid short opportunity with targets set at the lower demand range.
🛑 Risk management is essential in case of any false breakouts.
regards,
Alireza!
Trade active
Active TradeTrade closed: target reached
💰MY FREE FOREX CRYPTO SIGNALS TELEGRAM CHANNEL: : t.me/Alirezaktrade
Disclaimer
The information and publications are not meant to be, and do not constitute, financial, investment, trading, or other types of advice or recommendations supplied or endorsed by TradingView. Read more in the Terms of Use.