✅Yesterday, gold prices briefly surged due to heightened safe-haven demand, but we remained skeptical about the sustainability of the rebound and continued to uphold our strategy of shorting at higher levels. As expected, gold eventually moved lower, breaking below the previous day's low and establishing a bearish continuation pattern. Our bearish outlook was confirmed by market action.
✅In terms of price structure, although gold saw a moderate rebound during the latter part of the U.S. session, the momentum was weak, indicating that strong resistance remains overhead. The market continues to exhibit a bearish tone, so today’s strategy remains unchanged—waiting for a rebound to resume short positioning.
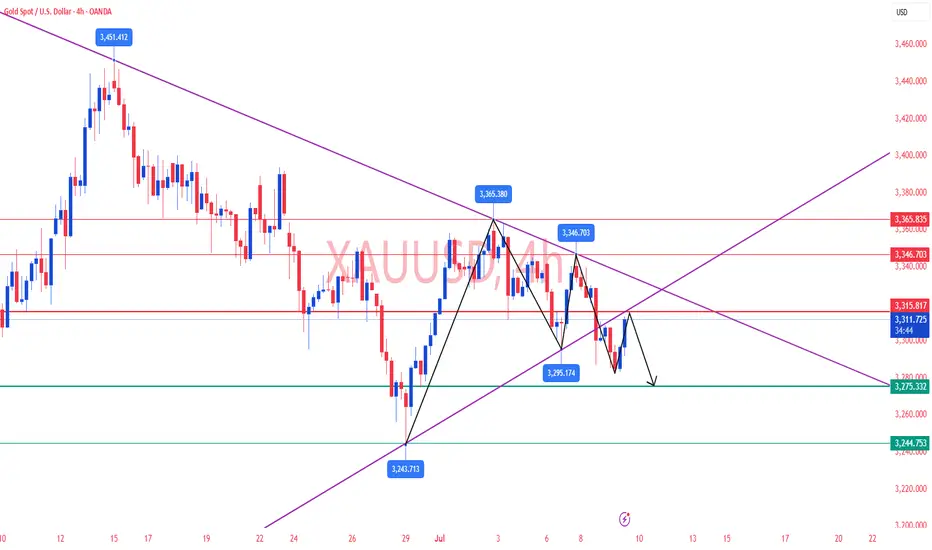
✅Technical Analysis:
🔸Daily Chart: Gold remains in a state of high-level consolidation with signs of momentum exhaustion. Yesterday’s price action saw resistance near the 3345 level once again, followed by a pullback. Although it temporarily broke below 3300, the price later recovered, reflecting a tug-of-war between bulls and bears. The candlestick pattern shows alternating bullish and bearish candles, lacking sustained direction, and no clear single-sided trend has emerged yet.
🔸4H Chart: Gold continues to trend lower in a step-like, descending pattern. The recent high at 3345 marks a lower high, and current resistance is forming near the downtrend line and the midline of the Bollinger Bands—around 3333 and 3320. Price action suggests high probability of rejection in this zone. We recommend continuing to short near resistance, with the next target at the 3255 level. The overall structure remains a slow, choppy downtrend.
🔸1H Chart: The bearish trend persists with new local lows being formed. Moving averages are aligned in a clear downtrend formation with strong bearish momentum. After breaking below 3313 yesterday, a minor rebound failed to hold, confirming 3313 as a key resistance level. Now, early trading is facing pressure near 3315, suggesting a good area to look for short entries.
🔴Key Resistance Zone: 3315–3320
🟢Key Support Zone: 3287–3275
✅Trading Strategy Reference:
🔻Short Strategy:
🔰Enter short positions in the 3313–3315 area in multiple entries.
🔰Stop loss: 8–10 USD
🔰Target: 3300–3285, with potential extension toward 3275 if support is broken.
🔺Long Strategy:
🔰Consider long positions in the 3275–3278 range with staggered entries.
🔰Stop loss: 8–10 USD
🔰Target: 3290–3300, with further upside potential toward 3305 if resistance breaks.
🔥Note: Trading strategies are time-sensitive. For more accurate and real-time Trading Signals, feel free to contact me directly.
✅In terms of price structure, although gold saw a moderate rebound during the latter part of the U.S. session, the momentum was weak, indicating that strong resistance remains overhead. The market continues to exhibit a bearish tone, so today’s strategy remains unchanged—waiting for a rebound to resume short positioning.
✅Technical Analysis:
🔸Daily Chart: Gold remains in a state of high-level consolidation with signs of momentum exhaustion. Yesterday’s price action saw resistance near the 3345 level once again, followed by a pullback. Although it temporarily broke below 3300, the price later recovered, reflecting a tug-of-war between bulls and bears. The candlestick pattern shows alternating bullish and bearish candles, lacking sustained direction, and no clear single-sided trend has emerged yet.
🔸4H Chart: Gold continues to trend lower in a step-like, descending pattern. The recent high at 3345 marks a lower high, and current resistance is forming near the downtrend line and the midline of the Bollinger Bands—around 3333 and 3320. Price action suggests high probability of rejection in this zone. We recommend continuing to short near resistance, with the next target at the 3255 level. The overall structure remains a slow, choppy downtrend.
🔸1H Chart: The bearish trend persists with new local lows being formed. Moving averages are aligned in a clear downtrend formation with strong bearish momentum. After breaking below 3313 yesterday, a minor rebound failed to hold, confirming 3313 as a key resistance level. Now, early trading is facing pressure near 3315, suggesting a good area to look for short entries.
🔴Key Resistance Zone: 3315–3320
🟢Key Support Zone: 3287–3275
✅Trading Strategy Reference:
🔻Short Strategy:
🔰Enter short positions in the 3313–3315 area in multiple entries.
🔰Stop loss: 8–10 USD
🔰Target: 3300–3285, with potential extension toward 3275 if support is broken.
🔺Long Strategy:
🔰Consider long positions in the 3275–3278 range with staggered entries.
🔰Stop loss: 8–10 USD
🔰Target: 3290–3300, with further upside potential toward 3305 if resistance breaks.
🔥Note: Trading strategies are time-sensitive. For more accurate and real-time Trading Signals, feel free to contact me directly.
✅𝐃𝐚𝐢𝐥𝐲 𝟐-𝟒 𝐓𝐫𝐚𝐝𝐢𝐧𝐠 𝐒𝐢𝐠𝐧𝐚𝐥𝐬🔥
✅𝐇𝐢𝐠𝐡 𝐀𝐜𝐜𝐮𝐫𝐚𝐜𝐲 𝟗𝟎%-𝟗𝟓% 🔥
✅𝐖𝐞𝐞𝐤𝐥𝐲 𝐲𝐢𝐞𝐥𝐝 𝟔𝟎%-𝟖𝟓%🔥
👉Free Group:t.me/+RQhjYR-k6i4yOTA1
✉️VIP Channel : t.me/Jack_blackwell
✅𝐇𝐢𝐠𝐡 𝐀𝐜𝐜𝐮𝐫𝐚𝐜𝐲 𝟗𝟎%-𝟗𝟓% 🔥
✅𝐖𝐞𝐞𝐤𝐥𝐲 𝐲𝐢𝐞𝐥𝐝 𝟔𝟎%-𝟖𝟓%🔥
👉Free Group:t.me/+RQhjYR-k6i4yOTA1
✉️VIP Channel : t.me/Jack_blackwell
Disclaimer
The information and publications are not meant to be, and do not constitute, financial, investment, trading, or other types of advice or recommendations supplied or endorsed by TradingView. Read more in the Terms of Use.