🌀 Elliott Wave Structure
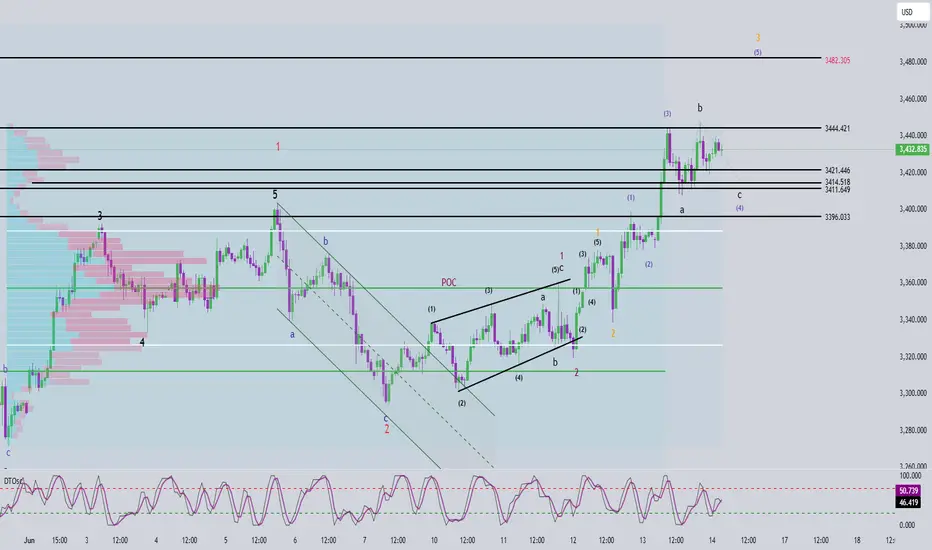
On the H1 timeframe, price is forming a 5-wave structure (1) (2) (3) (4) (5) in green, with the market currently in wave 4.
Last Friday, after breaking above the 3444 high, price failed to continue toward 3482 and instead reversed lower. This behavior suggests that wave 4 is developing as a Flat correction in black abc structure.
👉 Based on this outlook, wave c is expected to complete around 3314, marking the end of wave 4 in green. From there, a bullish impulse is anticipated to complete wave 5.
🔎 Momentum Overview
D1 timeframe: Momentum is rising → indicating the dominant trend for early this week is likely bullish.
H4 timeframe: Momentum is declining → supporting the scenario that wave c of wave 4 may still have one more leg down.
H1 timeframe: Momentum is about to turn downward → suggesting a potential drop during the Asian session on Monday.
🚨 However, ongoing geopolitical tensions in the Middle East could trigger unexpected price spikes, especially during the Asian session.
📈 Trade Plan
Buy Zone: 3415 – 3412
Stop Loss: 3405
Take Profit 1: 3444
Take Profit 2: 3482
👉 Join the channel to receive more scalping signals!
Channel Telegram: t.me/+XkFQ95yHVOEwNDc1
Channel Telegram: t.me/+XkFQ95yHVOEwNDc1
Related publications
Disclaimer
The information and publications are not meant to be, and do not constitute, financial, investment, trading, or other types of advice or recommendations supplied or endorsed by TradingView. Read more in the Terms of Use.