✅Yesterday, gold staged a strong “V-shaped reversal,” surging violently from the intraday low of $3247 to a high of $3309. The daily chart closed with a large bullish candlestick featuring a long lower shadow, initially confirming the validity of short-term bottom support and signaling a strong bullish rebound.
✅Fundamental Overview:
The U.S. Dollar Index recorded its sixth consecutive monthly decline, further falling today to 96.87—the longest losing streak since 2017. This reflects growing market expectations for future Fed rate cuts. A weakening dollar has strengthened non-U.S. currencies and reduced the holding cost of gold, providing upward momentum for gold prices.
✅Technical Analysis:
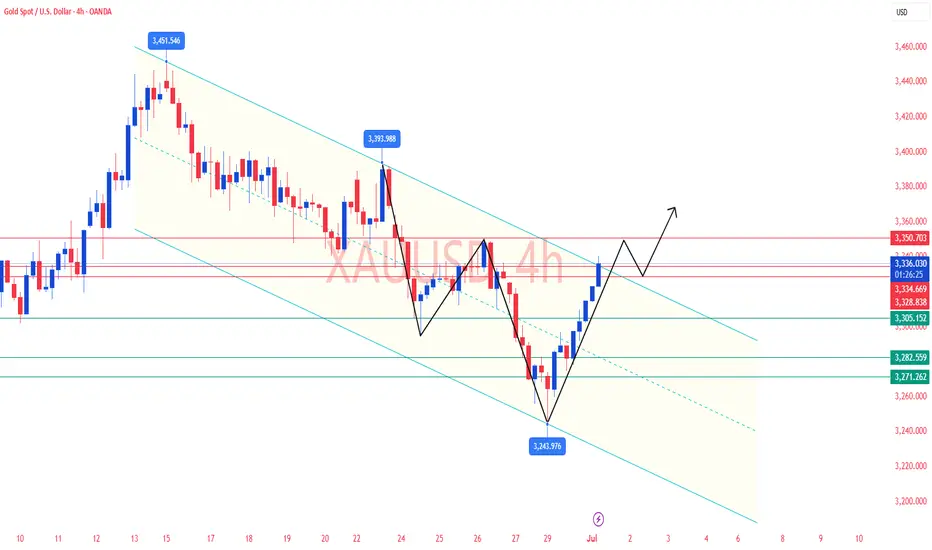
Gold is currently in a technical rebound phase. After reclaiming the key $3300 level yesterday, the short-term trend has returned to a bullish stance. A bullish consolidation structure is now confirmed. However, on the daily chart, prices are still capped below the 10-day and 20-day moving averages (around $3330–3340), while the RSI remains in a weak adjustment phase below the midline, suggesting medium-term direction remains uncertain. In the short term, bulls dominate. The 4-hour chart shows consecutive bullish candles breaking above the middle Bollinger Band, with a golden cross forming near the $3285 area. The 1-hour chart shows Bollinger Bands expanding upward, with prices riding the upper band and moving averages in bullish alignment.
🔴Key Resistance Levels: 3328 – 3335 – 3348
🟢Key Support Levels: 3305 – 3282 – 3271
✅Trading Strategy for Asia–Europe Session:
🔹 Long Positions:
🔰If gold remains firmly above $3300, consider entering long positions on pullbacks to the $3305–3308 zone. Set a stop-loss below $3300 and aim for a target range of $3328–3335.
🔰If the price breaks above the $3328 resistance with volume confirmation, consider adding to long positions near $3330, with upside targets at $3345–3350.
🔹 Short Positions:
🔰If gold rallies toward $3328 but fails to break through, and upward momentum weakens, consider light short positions. Set a stop-loss above $3335, with downside targets at $3310–3305.
🔰If the price unexpectedly breaks below the $3280 support, possibly triggering algorithmic selling, the correction may extend further toward the $3250–3260 range.
✅Currently, gold continues to show a moderately bullish trend, and the European session is expected to fluctuate within the core range of $3300–3335. Strategically, it's recommended to prioritize buying on dips, with shorts considered only on failed rallies. If upcoming U.S. data strengthens expectations for Fed rate cuts, gold could break above the $3350 threshold. Conversely, if the data is strong or geopolitical risks ease, be cautious of a potential pullback, with key defense support at $3280.
✅Fundamental Overview:
The U.S. Dollar Index recorded its sixth consecutive monthly decline, further falling today to 96.87—the longest losing streak since 2017. This reflects growing market expectations for future Fed rate cuts. A weakening dollar has strengthened non-U.S. currencies and reduced the holding cost of gold, providing upward momentum for gold prices.
✅Technical Analysis:
Gold is currently in a technical rebound phase. After reclaiming the key $3300 level yesterday, the short-term trend has returned to a bullish stance. A bullish consolidation structure is now confirmed. However, on the daily chart, prices are still capped below the 10-day and 20-day moving averages (around $3330–3340), while the RSI remains in a weak adjustment phase below the midline, suggesting medium-term direction remains uncertain. In the short term, bulls dominate. The 4-hour chart shows consecutive bullish candles breaking above the middle Bollinger Band, with a golden cross forming near the $3285 area. The 1-hour chart shows Bollinger Bands expanding upward, with prices riding the upper band and moving averages in bullish alignment.
🔴Key Resistance Levels: 3328 – 3335 – 3348
🟢Key Support Levels: 3305 – 3282 – 3271
✅Trading Strategy for Asia–Europe Session:
🔹 Long Positions:
🔰If gold remains firmly above $3300, consider entering long positions on pullbacks to the $3305–3308 zone. Set a stop-loss below $3300 and aim for a target range of $3328–3335.
🔰If the price breaks above the $3328 resistance with volume confirmation, consider adding to long positions near $3330, with upside targets at $3345–3350.
🔹 Short Positions:
🔰If gold rallies toward $3328 but fails to break through, and upward momentum weakens, consider light short positions. Set a stop-loss above $3335, with downside targets at $3310–3305.
🔰If the price unexpectedly breaks below the $3280 support, possibly triggering algorithmic selling, the correction may extend further toward the $3250–3260 range.
✅Currently, gold continues to show a moderately bullish trend, and the European session is expected to fluctuate within the core range of $3300–3335. Strategically, it's recommended to prioritize buying on dips, with shorts considered only on failed rallies. If upcoming U.S. data strengthens expectations for Fed rate cuts, gold could break above the $3350 threshold. Conversely, if the data is strong or geopolitical risks ease, be cautious of a potential pullback, with key defense support at $3280.
✅𝐃𝐚𝐢𝐥𝐲 𝟐-𝟒 𝐓𝐫𝐚𝐝𝐢𝐧𝐠 𝐒𝐢𝐠𝐧𝐚𝐥𝐬🔥
✅𝐇𝐢𝐠𝐡 𝐀𝐜𝐜𝐮𝐫𝐚𝐜𝐲 𝟗𝟎%-𝟗𝟓% 🔥
✅𝐖𝐞𝐞𝐤𝐥𝐲 𝐲𝐢𝐞𝐥𝐝 𝟔𝟎%-𝟖𝟓%🔥
👉Free Group:t.me/+RQhjYR-k6i4yOTA1
✉️VIP Channel : t.me/Jack_blackwell
✅𝐇𝐢𝐠𝐡 𝐀𝐜𝐜𝐮𝐫𝐚𝐜𝐲 𝟗𝟎%-𝟗𝟓% 🔥
✅𝐖𝐞𝐞𝐤𝐥𝐲 𝐲𝐢𝐞𝐥𝐝 𝟔𝟎%-𝟖𝟓%🔥
👉Free Group:t.me/+RQhjYR-k6i4yOTA1
✉️VIP Channel : t.me/Jack_blackwell
Disclaimer
The information and publications are not meant to be, and do not constitute, financial, investment, trading, or other types of advice or recommendations supplied or endorsed by TradingView. Read more in the Terms of Use.