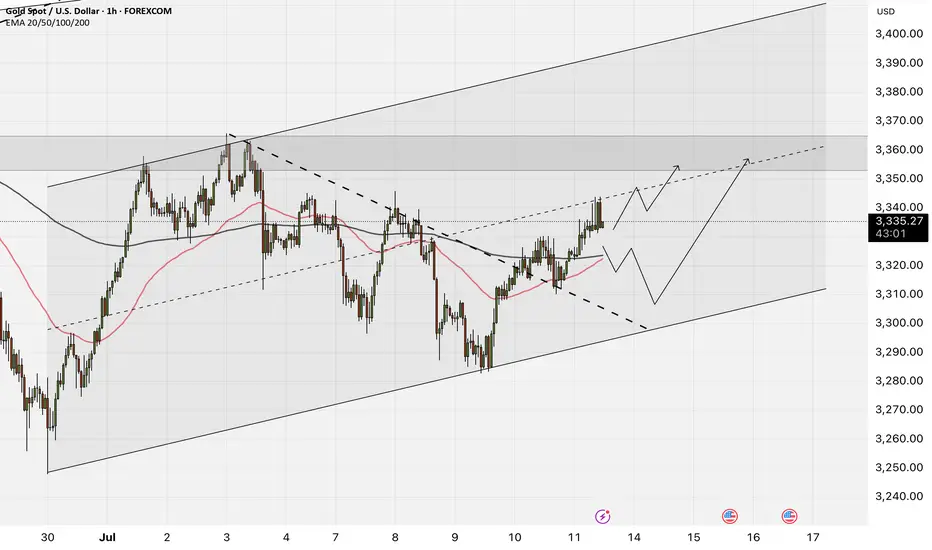
Gold is trading above the EMA200 and EMA50 on the hourly chart and is trading in its ascending channel. We still have a bullish view on this commodity and we can expect to see $3,350. A correction towards the bottom of the ascending channel will also provide us with a better risk-reward buying opportunity.
According to the World Gold Council, physically backed gold ETFs attracted around $38 billion in investments during the first half of 2025. This marks the largest semi-annual inflow since the beginning of 2020. The remarkable surge is primarily attributed to heightened investor demand for safe-haven assets amid escalating economic and trade tensions triggered by President Trump’s tariff policies.
During this period, the total gold holdings of these funds grew by 397.1 tonnes, bringing their global assets to 3,615.9 tonnes by the end of June—the highest level since August 2022, although still below the all-time high of 3,915 tonnes recorded in October 2020.
U.S.-based funds led the inflows with an addition of 206.8 tonnes, while Asian funds—despite accounting for only 9% of total assets—captured 28% of global inflows, highlighting a significant rise in interest among Asian investors in gold.
This positive trend emerged after three consecutive years of outflows between 2021 and 2023, followed by modest inflows in 2024. Concurrently, gold prices have surged by 26%, reaching a record high of $3,500 per ounce in April.
The World Gold Council, established in 1987 and headquartered in London, is funded by major gold mining companies. Its main objectives include boosting global demand for gold, enhancing market accessibility, and promoting innovation within the gold industry. The council plays a crucial role in shaping global perceptions of gold as a financial asset.
However, some analysts argue that the council essentially functions as a powerful lobbying group for mining corporations, often releasing reports designed to bolster demand and foster a positive market sentiment toward gold.
On the other hand, Bank of America (BofA), in its latest report using a global trading time framework, analyzed the outlook for the U.S. dollar in the second half of 2025. Despite the dollar having its worst start to a year since 1973, the report suggests that selling pressures on the currency may ease going forward, particularly during U.S. trading hours.
U.S. Trading Hours and Federal Reserve Policy
The dollar’s cumulative performance during U.S. trading hours remains strongly correlated—at 71%—with Federal Reserve interest rate pricing. Given expectations for stable rates throughout the rest of the year, the dollar could find some support during this time frame.
Asia: The Main Driver of Dollar Selling in H1 2025
Asian investors were the largest sellers of the dollar during the first half of 2025. However, after fully unwinding the long positions accumulated over the past two years, dollar performance in Asian trading hours has now turned neutral. Fresh selling may remain limited unless new bearish catalysts emerge.
Europe: Tied to Global Equities’ Performance
Dollar weakness during European trading hours largely depends on the relative strength of global equities versus U.S. stocks. As U.S. equities reclaimed market leadership in the second quarter, European investors may have less incentive to continue selling dollars.
Decline in Currency Hedging Appetite
Following the dollar’s significant drop in the first half of the year, foreign investors are now less inclined to increase currency hedges on their dollar-denominated assets.
According to Bank of America’s trading time framework, the pace of the dollar’s decline is likely to slow in the second half of the year, especially during U.S. trading hours, as stable Federal Reserve policy removes a key bearish factor. Selling pressure from Asia is also expected to ease unless new downside triggers arise. The key variable going forward will be the relative performance of global equities versus U.S. markets.
Disclaimer
The information and publications are not meant to be, and do not constitute, financial, investment, trading, or other types of advice or recommendations supplied or endorsed by TradingView. Read more in the Terms of Use.
Disclaimer
The information and publications are not meant to be, and do not constitute, financial, investment, trading, or other types of advice or recommendations supplied or endorsed by TradingView. Read more in the Terms of Use.