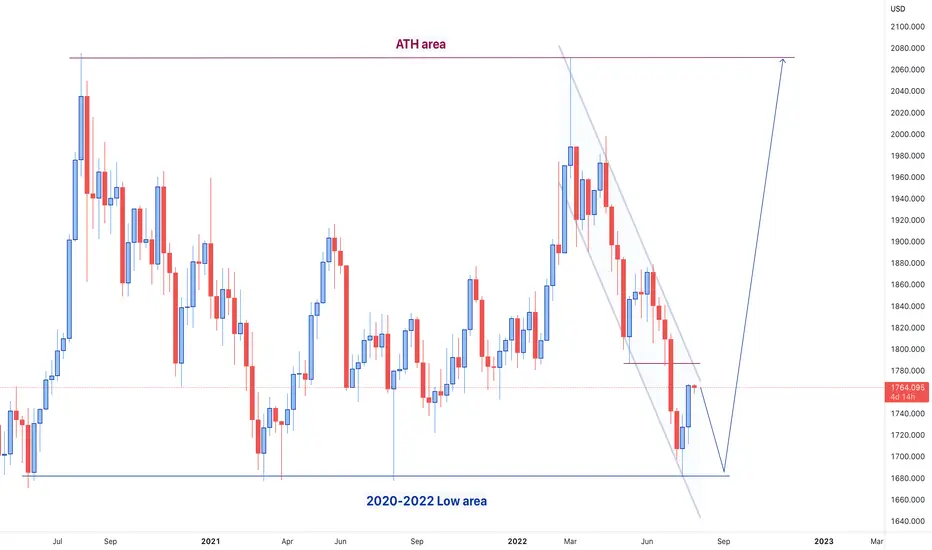
By taking a look at the Weekly timeframe chart of Gold, it can be observed that the price has nicely bounced off the area of the 2020-2022 Low that serves as a crucial area of support. It can also be inferred that a massive sideways-moving range has been formed and the price has rejected the lower barrier of it.
Zooming into lower timeframe charts, we can notice that an ascending channel has been formed and the lower boundary of it has been rejected. At the moment, the price is slowly approaching the zone of the previous Lower Low and we are expecting for a pullback to happen before bullish moves continue.
Thus, we are gonna closely monitor the price action and wait for some more bullish confirmations around the major zone of support portrayed on the chart before we enter long-term BUY positions and target the upper barrier of the rectangular range.
Disclaimer
The information and publications are not meant to be, and do not constitute, financial, investment, trading, or other types of advice or recommendations supplied or endorsed by TradingView. Read more in the Terms of Use.
Disclaimer
The information and publications are not meant to be, and do not constitute, financial, investment, trading, or other types of advice or recommendations supplied or endorsed by TradingView. Read more in the Terms of Use.