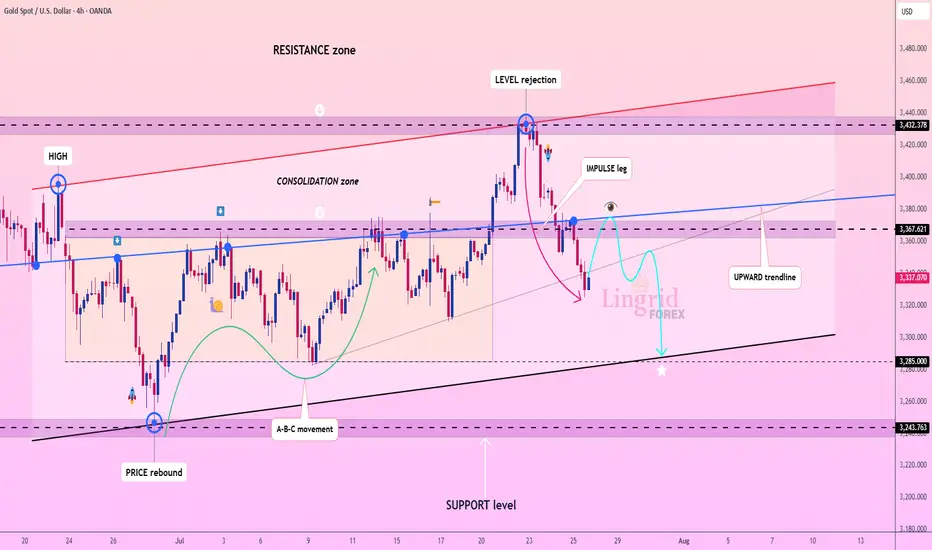
The 4H chart reveals a clear level rejection at the resistance zone, followed by an impulse leg lower that has broken the upward trendline. This development suggests a potential shift in short-term momentum, with gold now trading within the consolidation zone between $3,365 and $3,285. The break of the ascending trendline is particularly significant, indicating that bulls may be losing control of the immediate price action.
The second chart provides valuable context with the weekly and 16-hour timeframe analysis. The pinbar rejection candle on the weekly chart confirms strong selling pressure at these elevated levels. The 16-hour chart shows multiple tests of the upward trendline, with the recent break potentially signaling a bearish impulse leg. However, the overall structure remains within the broader ascending channel, suggesting this could be a healthy correction within the long-term uptrend.
Critical levels to monitor include the $3,285 support zone and the broken trendline at $3,365. A decisive break below $3,285 could trigger a deeper correction toward $3,200, while reclaiming the upward trendline would restore bullish momentum toward new highs.
If this idea resonates with you or you have your own opinion, traders, hit the comments. I’m excited to read your thoughts!
Trade active
📉 Key Levels
- Sell trigger: Bearish rejection near 3370
- Sell zone: 3367 – 3380
- Target: 3300
- Invalidation: Daily close above 3385
💡 Risks
- Uptrend line at 3300 may attract aggressive dip buyers
- Strong economic news can spark sudden bullish reversals
- Consolidation before breakdown may delay bearish continuation
💰FREE FOREX signals in Telegram: bit.ly/3F4mrMi
🚀FREE CRYPTO signals in Telegram: t.me/cryptolingrid
🌎WebSite: lingrid.org
🚀FREE CRYPTO signals in Telegram: t.me/cryptolingrid
🌎WebSite: lingrid.org
Disclaimer
The information and publications are not meant to be, and do not constitute, financial, investment, trading, or other types of advice or recommendations supplied or endorsed by TradingView. Read more in the Terms of Use.