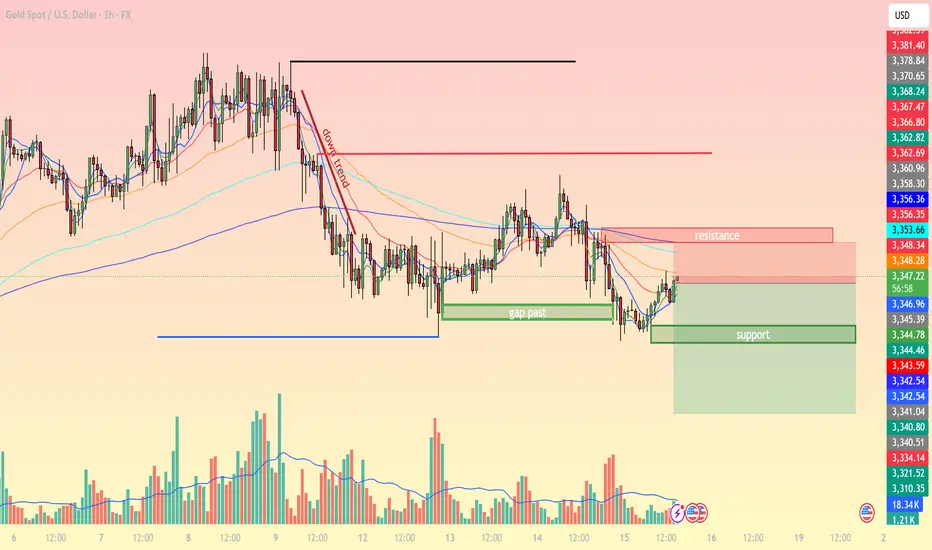
On the H1 timeframe, gold is showing a mild recovery after touching the key support zone around 3,344 – 3,345 USD/oz, which also coincides with a previously filled gap past area. The prior bearish momentum originated from the 3,362 – 3,367 highs, keeping the short-term trend in a downtrend structure.
Technical Analysis:
EMA: Price is currently trading below the short-term EMAs (20, 50) but is attempting to push higher to retest resistance. The 200 EMA acts as a dynamic barrier near 3,353.
RSI: The H1 RSI shows improving bullish momentum but is not yet in overbought territory, allowing room for a technical rebound.
Fibonacci: The 3,348 – 3,353 area aligns with the 38.2% Fib retracement of the recent down move, making it a strong resistance zone.
Resistance: 3,348 – 3,353, followed by 3,362.
Support: 3,344 – 3,345, with deeper support at 3,343 – 3,342.
Trading Strategy Ideas:
Sell near resistance: Watch for bearish candlestick signals on the H1 chart around 3,348 – 3,353 to open short positions targeting 3,344 – 3,342.
Scalp buy: If price holds above 3,344 and breaks 3,353, consider buying toward 3,362.
Risk management: Place stop-loss above 3,356 for shorts and below 3,342 for longs to manage volatility risk.
At the moment, the market is in a resistance test phase, so trading based on price action around support–resistance levels can be more effective than chasing trends.
Keep a close watch on 3,348 – 3,353 as this zone will likely determine gold’s next short-term move. Save this analysis if you find it useful for upcoming sessions.
Trade active
Do you have any other comments? Please comment below.🪙 JOIN OUR FREE TELEGRAM GROUP 🪙
t.me/dnaprofits
Join the community group to get support and share knowledge!
️🥇 Exchange and learn market knowledge
️🥇 Support free trading signals
t.me/dnaprofits
Join the community group to get support and share knowledge!
️🥇 Exchange and learn market knowledge
️🥇 Support free trading signals
Related publications
Disclaimer
The information and publications are not meant to be, and do not constitute, financial, investment, trading, or other types of advice or recommendations supplied or endorsed by TradingView. Read more in the Terms of Use.
🪙 JOIN OUR FREE TELEGRAM GROUP 🪙
t.me/dnaprofits
Join the community group to get support and share knowledge!
️🥇 Exchange and learn market knowledge
️🥇 Support free trading signals
t.me/dnaprofits
Join the community group to get support and share knowledge!
️🥇 Exchange and learn market knowledge
️🥇 Support free trading signals
Related publications
Disclaimer
The information and publications are not meant to be, and do not constitute, financial, investment, trading, or other types of advice or recommendations supplied or endorsed by TradingView. Read more in the Terms of Use.