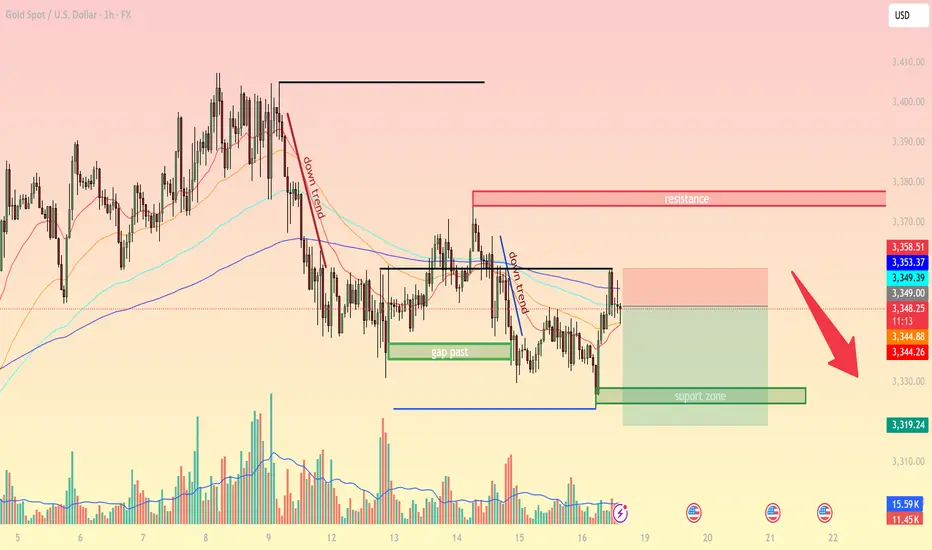
On the H1 timeframe, gold is trading around 3,348 – 3,350 USD/oz after a short-term rebound from support. Price action and technical signals suggest the following:
1. Market Structure
The short-term trend remains bearish with lower highs being formed.

Price tested the EMA 100–200 resistance zone but failed to break above.
The previous gap zone has acted as an important pivot area.
2. Key Support & Resistance Levels
Immediate Resistance: 3,355 – 3,358 (EMA200 + supply zone)
Major Resistance: 3,370 – 3,380 (resistance area)
Immediate Support: 3,344 – 3,345
Strong Support: 3,330 – 3,320 (support zone aligned with Fibonacci 61.8%)
3. Technical Indicators
EMA 20–50: slightly turning upward, but still below EMA200 → suggesting only a corrective bounce.
RSI H1: around 55, showing room to move lower.
Volume: recent bullish candles lack strong volume → possible bull trap.
4. Trading Strategies
Sell Setup (trend-following):
Entry: 3,349 – 3,355
SL: above 3,370
TP1: 3,335
TP2: 3,320
Buy Setup (counter-trend at support):
Entry: 3,320 – 3,325 (support zone)
SL: 3,310
TP1: 3,340
TP2: 3,355
Outlook
Gold is still under bearish pressure as long as it trades below 3,370. Only a confirmed breakout above this zone may shift momentum to the upside.
Save these price levels for your trading plan. Follow along for more refined strategies throughout the week.
1. Market Structure
The short-term trend remains bearish with lower highs being formed.
Price tested the EMA 100–200 resistance zone but failed to break above.
The previous gap zone has acted as an important pivot area.
2. Key Support & Resistance Levels
Immediate Resistance: 3,355 – 3,358 (EMA200 + supply zone)
Major Resistance: 3,370 – 3,380 (resistance area)
Immediate Support: 3,344 – 3,345
Strong Support: 3,330 – 3,320 (support zone aligned with Fibonacci 61.8%)
3. Technical Indicators
EMA 20–50: slightly turning upward, but still below EMA200 → suggesting only a corrective bounce.
RSI H1: around 55, showing room to move lower.
Volume: recent bullish candles lack strong volume → possible bull trap.
4. Trading Strategies
Sell Setup (trend-following):
Entry: 3,349 – 3,355
SL: above 3,370
TP1: 3,335
TP2: 3,320
Buy Setup (counter-trend at support):
Entry: 3,320 – 3,325 (support zone)
SL: 3,310
TP1: 3,340
TP2: 3,355
Outlook
Gold is still under bearish pressure as long as it trades below 3,370. Only a confirmed breakout above this zone may shift momentum to the upside.
Save these price levels for your trading plan. Follow along for more refined strategies throughout the week.
🪙 JOIN OUR FREE TELEGRAM GROUP 🪙
t.me/dnaprofits
Join the community group to get support and share knowledge!
️🥇 Exchange and learn market knowledge
️🥇 Support free trading signals
t.me/dnaprofits
Join the community group to get support and share knowledge!
️🥇 Exchange and learn market knowledge
️🥇 Support free trading signals
Related publications
Disclaimer
The information and publications are not meant to be, and do not constitute, financial, investment, trading, or other types of advice or recommendations supplied or endorsed by TradingView. Read more in the Terms of Use.