1. Overview of the Chart
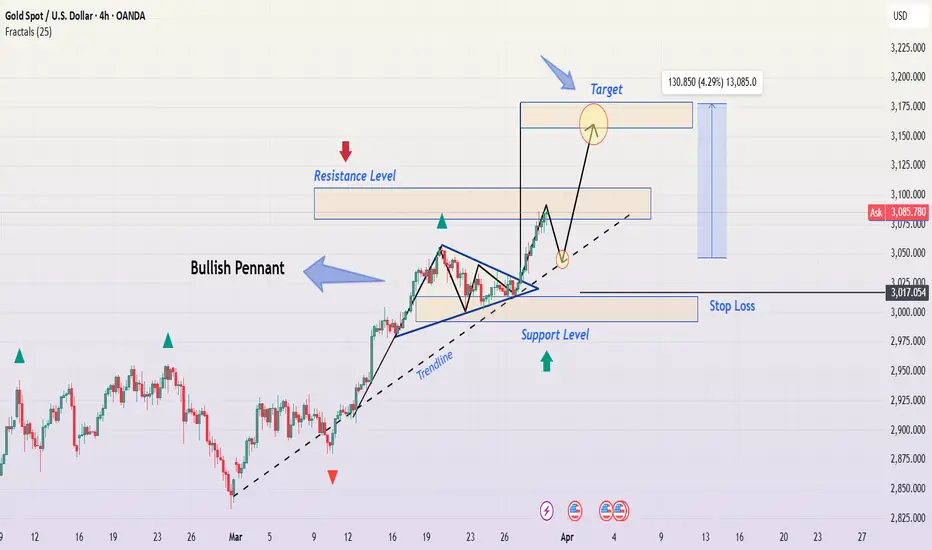
This 4-hour chart of Gold Spot (XAU/USD) presents a bullish pennant pattern, which is a strong continuation formation, indicating that the price is likely to continue its upward trajectory. The price action has followed a clear trend structure, and we can identify key support and resistance levels, breakout points, and potential profit targets.
This analysis provides a comprehensive breakdown of the chart setup, including:
The technical pattern formation
Key support and resistance zones
Trade setup with an ideal entry, stop loss, and profit target
Risk management considerations
Market conditions and external factors to monitor
2. Breakdown of the Chart Pattern: Bullish Pennant Formation
Understanding the Bullish Pennant Pattern
A bullish pennant is a continuation pattern that occurs after a strong upward movement (known as the "flagpole"). The market then consolidates within a small triangular shape, forming the pennant. This consolidation is seen as a temporary pause before the next bullish move.
Key Characteristics of the Pennant in this Chart
Flagpole Formation:
The steep rally before the pennant formed represents a strong bullish impulse, driven by increased buying pressure.
This rapid price increase set the foundation for the pennant pattern.
Consolidation (Pennant Formation):
Price action moved within converging trendlines, forming a symmetrical triangular pattern.
The market temporarily paused, as some traders took profits while others awaited further momentum.
This type of consolidation is common before the price resumes its trend.
Breakout from the Pennant:
The bullish breakout above the upper trendline of the pennant confirms the continuation of the uptrend.
A strong breakout suggests renewed buying interest, likely pushing prices toward the next resistance level.
3. Key Technical Levels on the Chart
A. Resistance Level (Potential Selling Zone)
A critical resistance zone is marked between $3,100 - $3,125, where selling pressure could emerge.
If the price faces rejection in this zone, a temporary retracement could occur before another push higher.
A breakout above this resistance level would further strengthen the bullish case, possibly pushing gold toward the $3,175 - $3,200 range.
B. Support Level (Demand Zone)
The support zone is around $3,025 - $3,017, which is the last significant swing low.
This level represents a strong buying area where traders may look for re-entry on a pullback.
A break below this support could invalidate the bullish setup, signaling a shift in market sentiment.
C. Trendline Support (Dynamic Support)
The dashed black trendline represents an uptrend support.
If price retraces toward this level and holds, it may offer another buying opportunity before resuming its uptrend.
A break below this trendline would be a warning signal, suggesting a weakening of bullish momentum.
4. Trade Setup and Execution Strategy
A. Entry Strategy
The ideal entry point was upon the confirmed breakout above the pennant, around $3,075 - $3,085.
Aggressive traders may have entered at the breakout itself.
Conservative traders may wait for a pullback to retest the breakout zone before entering, ensuring confirmation.
B. Stop Loss Placement (Risk Management)
A stop loss is placed below the support zone at $3,017 to minimize downside risk.
This placement protects against false breakouts or unexpected market reversals.
Keeping a tight stop loss allows for a higher risk-to-reward ratio while maintaining a disciplined approach.
C. Profit Target Projection (Expected Price Movement)
The target price is determined using the measured move approach, where the height of the flagpole is added to the breakout point.
The expected profit target is in the range of $3,175 - $3,200, offering a potential upside of 4.29% from the breakout level.
If price maintains its bullish momentum, further gains could be expected beyond the target zone.
5. Risk Management & Considerations
A. Risk-to-Reward Ratio (RRR)
This trade setup provides a favorable risk-to-reward ratio (RRR).
With an entry near $3,085, a stop loss at $3,017, and a target around $3,175, the trade offers a reward-to-risk ratio of approximately 3:1.
This ensures that even if the trade does not succeed, the risk is controlled while allowing significant upside potential.
B. Factors That Could Invalidate the Setup
Failure to sustain the breakout: If price falls back below the pennant, the setup may be invalid.
Break below the support zone ($3,017): This would signal a possible trend reversal.
Weak volume on breakout: A lack of volume could indicate a false breakout, leading to price retracement.
C. Alternative Trade Scenarios
Scenario 1: Retest & Continuation:
If price pulls back to retest the breakout zone ($3,075 - $3,085) and holds, traders can look for another buying opportunity.
Scenario 2: False Breakout & Reversal:
If price falls below the support level ($3,017), traders should exit long positions and re-evaluate market conditions.
6. Market Conditions & External Factors to Monitor
A. Gold’s Correlation with USD & Interest Rates
Stronger USD → Downward Pressure on Gold
Weaker USD → Bullish Gold Trend
Interest rate decisions from the U.S. Federal Reserve play a significant role in gold prices.
B. Economic Events & News Impact
Inflation Reports: Higher inflation often supports gold prices.
Geopolitical Tensions: Political instability can lead to increased demand for gold as a safe-haven asset.
Stock Market Movements: A weaker stock market can drive capital into gold.
7. Conclusion: Bullish Outlook with Cautious Optimism
Key Takeaways:
✔ Bullish pennant breakout confirmed – strong continuation signal.
✔ Price is above key support & trendline – maintaining bullish structure.
✔ Clear trade plan with entry, stop loss, and target levels.
Trading Plan Summary:
Entry Stop Loss Target Risk-Reward Ratio
$3,075 - $3,085 $3,017 $3,175 - $3,200 3:1
📌 Final Recommendation:
Maintain a bullish bias as long as price holds above the support zone ($3,017).
Watch for volume confirmation to ensure the breakout is valid.
Adjust stop loss or secure profits if price reaches key resistance levels ($3,100 - $3,125).
If you need further clarification or alternative trade scenarios, let me know! 🚀
Related publications
Disclaimer
The information and publications are not meant to be, and do not constitute, financial, investment, trading, or other types of advice or recommendations supplied or endorsed by TradingView. Read more in the Terms of Use.
Related publications
Disclaimer
The information and publications are not meant to be, and do not constitute, financial, investment, trading, or other types of advice or recommendations supplied or endorsed by TradingView. Read more in the Terms of Use.