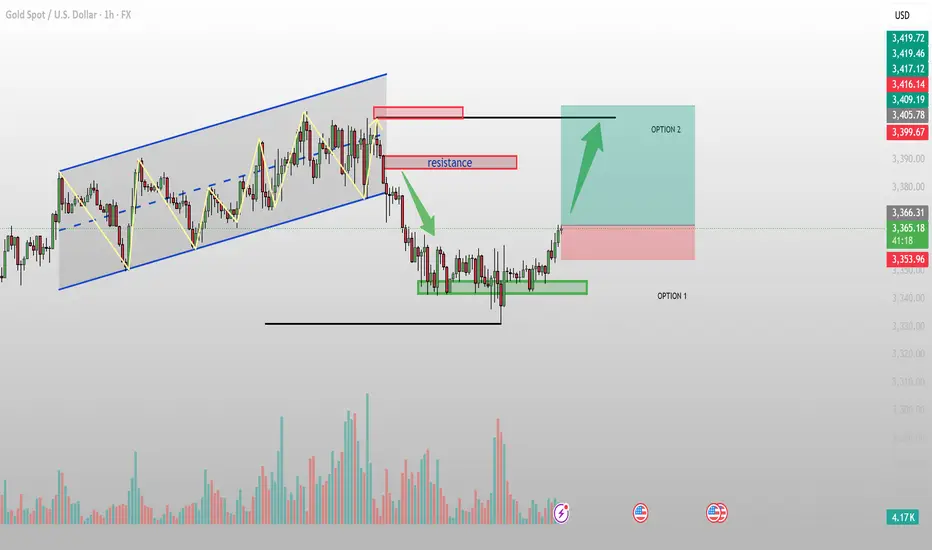
Gold has completed a corrective phase after breaking down from its previous ascending channel. On the H1 chart, price has formed a base around 3,340 – 3,350 and is now pushing higher, showing signs of bullish momentum with a clear breakout from the consolidation box.
Key Technical Levels:
Immediate Support: 3,353 – 3,340 (Option 1 SL zone)
Major Support: 3,314 – 3,306 (last defensive demand zone)
Immediate Resistance: 3,377 – 3,380 (minor obstacle)
Primary Target Resistance: 3,399 – 3,405 (Option 2 TP zone)

Technical Insights:
Trend Structure: Price previously respected the ascending channel but lost momentum, leading to a downtrend. Current breakout suggests a potential reversal attempt
Volume: Increasing volume during breakout adds confidence to bullish bias.
Risk-Reward: Current setup offers R:R ~ 3.47, attractive for intraday swing.
EMA & RSI: EMA turning upward; RSI is neutral, allowing more upside before overbought pressure kicks in.
Fibonacci: The 0.5–0.618 retracement from the last swing drop aligns with the 3,399–3,405 target zone.
Trade Strategy:
Option 1 – Breakout Continuation (Active Setup)
Entry: 3,365 – 3,366 (current price zone)
Stop Loss: 3,353
Take Profit: 3,405
R:R: ~3.47
Option 2 – Pullback Buy
Entry: On retest of 3,353–3,340 support zone with bullish confirmation.
Stop Loss: Below 3,330
Take Profit: First TP at 3,380, second TP at 3,405.
Bias:
Bullish short-term outlook while holding above 3,340. A break and close above 3,380 would strengthen the case for reaching 3,405.
Key Technical Levels:
Immediate Support: 3,353 – 3,340 (Option 1 SL zone)
Major Support: 3,314 – 3,306 (last defensive demand zone)
Immediate Resistance: 3,377 – 3,380 (minor obstacle)
Primary Target Resistance: 3,399 – 3,405 (Option 2 TP zone)
Technical Insights:
Trend Structure: Price previously respected the ascending channel but lost momentum, leading to a downtrend. Current breakout suggests a potential reversal attempt
Volume: Increasing volume during breakout adds confidence to bullish bias.
Risk-Reward: Current setup offers R:R ~ 3.47, attractive for intraday swing.
EMA & RSI: EMA turning upward; RSI is neutral, allowing more upside before overbought pressure kicks in.
Fibonacci: The 0.5–0.618 retracement from the last swing drop aligns with the 3,399–3,405 target zone.
Trade Strategy:
Option 1 – Breakout Continuation (Active Setup)
Entry: 3,365 – 3,366 (current price zone)
Stop Loss: 3,353
Take Profit: 3,405
R:R: ~3.47
Option 2 – Pullback Buy
Entry: On retest of 3,353–3,340 support zone with bullish confirmation.
Stop Loss: Below 3,330
Take Profit: First TP at 3,380, second TP at 3,405.
Bias:
Bullish short-term outlook while holding above 3,340. A break and close above 3,380 would strengthen the case for reaching 3,405.
🪙 JOIN OUR FREE TELEGRAM GROUP 🪙
t.me/dnaprofits
Join the community group to get support and share knowledge!
️🥇 Exchange and learn market knowledge
️🥇 Support free trading signals
t.me/dnaprofits
Join the community group to get support and share knowledge!
️🥇 Exchange and learn market knowledge
️🥇 Support free trading signals
Related publications
Disclaimer
The information and publications are not meant to be, and do not constitute, financial, investment, trading, or other types of advice or recommendations supplied or endorsed by TradingView. Read more in the Terms of Use.