Core logic analysis:
Risk aversion cools down
The easing of Sino-US trade tensions weakens the short-term safe-haven demand for gold, but long-term uncertainties (such as the prospects for global economic recovery and the Fed's policies) still support the safe-haven properties of gold.
Technical bearishness dominates
Weekly: Inverted hammer pattern + MACD high dead cross sign, suggesting a callback risk.
Daily: Two consecutive negatives fell below the short-term moving average, MACD dead cross, but be wary of the support strength of the Bollinger middle track (near 3295).
4 hours: The price broke below the Bollinger lower track, the moving average was in a short position, the MACD momentum was downward, and the short-term was bearish.
Key price:
Upper resistance:
First resistance: 3328-3330 (intraday strength and weakness boundary, bearish force point).
Strong resistance: 3345-3350 (if broken, the short-term bearish trend may be reversed).
Support below:
First support: 3290-3280 (test target at the beginning of the week, may trigger a rebound).
Strong support: 3280 (break opens the downward space to 3250-3230).
Operation strategy suggestions
Short order opportunity
Aggressive: short with a light position after rebounding to 3325-3330, stop loss above 3340, target 3300-3290.
Conservative: wait for the 3340-3345 area to be under pressure before entering the market, stop loss 3355, target the same as before.
Long order opportunity
Short-term rebound: If it first touches 3280-3290 and stabilizes (not breaking down quickly), you can go long with a light position on the rebound, stop loss 3275, target 3310-3320.
Rebound after breaking: If it quickly breaks down 3280 and rebounds to 3295-3300 under pressure, you can follow the short position for the second time.
Breakout response
Break above 3350: Short orders temporarily exit the market, wait and see whether it will step back to confirm the support and turn long.
Break below 3275: Be cautious in chasing shorts, prevent low-level technical rebounds, and wait for a pullback before following up with shorts.
Risk warning
Data risk: Market volatility may increase before and after the release of non-agricultural data, and be wary of wash-outs.
Sudden events: Sudden changes in geopolitical or Fed policy expectations may reverse technical patterns.
Position management: The current trend is bearish but has not been confirmed to be unilateral. It is recommended to operate with light positions in stages to avoid heavy positions betting on the direction.
Summary: Gold is likely to continue to fluctuate and be bearish next week, but be wary of bullish counterattacks at key support levels. The main trading method is shorting at the rebound high point, supplemented by short buying at the key support level, strictly stop loss and pay attention to the news developments.
Trade active
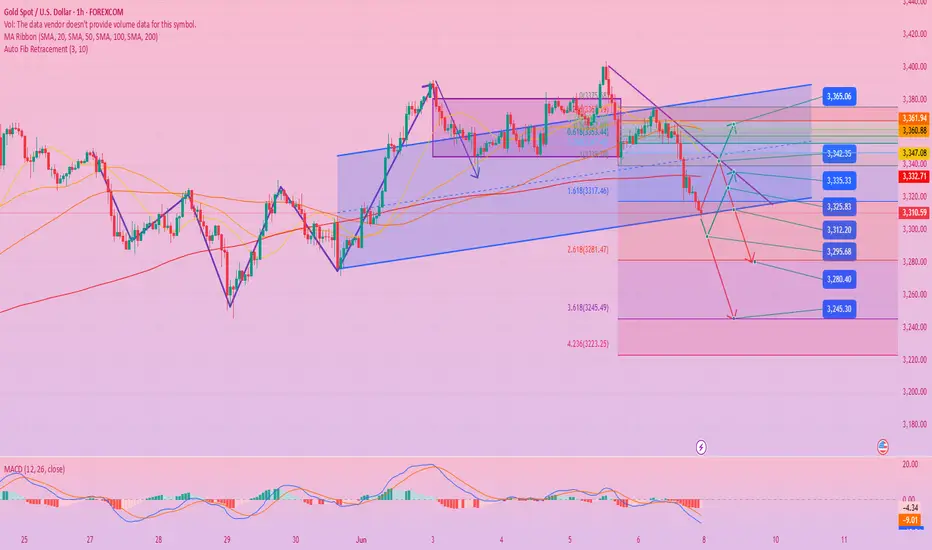
Technical Outlook for Next Week:1: In 4 hours, the stochastic indicator continues to cross downward, which is a bearish signal; in terms of form, the short-term decline stops near 3300, and there is a need for adjustment and rebound in the short term; therefore, in 4 hours, we first look at the rebound correction in the short term, and the pressure positions are 3320-3340;
2: In the daily K, the central axis track support position is near 3300, the stochastic indicator diverges from the dead cross, and the form is continuous; in the short term, it stops falling near 3300, and we look at the rebound correction. After the rebound, we will choose to short sell, and the game range will fluctuate downward;
3: In terms of trend, the main trend is currently the oscillating trend, and the range of the oscillating trend is positioned in the range of 3500-2950; the focus of the trend is in the cycle of the weekly K; the weekly K is time for space, and we will continue to suffer in the oscillating trend of 3500-2950 later, and we need to wait for the subsequent strong fundamentals to stimulate the market; [At the same time, the weekly K is time for space, and the central axis position has moved up to the position near 3000]
Trade closed: target reached
Gold trend analysis:
From the weekly level, gold has peaked and fallen since it hit 3500. It is still in a wide range of 3500-3120. The overall bullish trend has not changed. In the short term, the adjustment is not over. This week, we need to pay attention to the break of the moving average ma5 and ma10. At present, ma5 and ma10 are glued together and intersected near 3293. If the closing line this week is still stable above this level, the market outlook is further bullish and will attack 3400-3500. If it falls below 3293, the market outlook can seek support from the middle track 3120 or even lower. It is not recommended to be overly bearish before the moving average support is broken.
From the daily level, the daily line went out of continuous negative last Friday, and closed below ma5 and ma10. There is further downward momentum in the short term. However, the Bollinger Bands have shown signs of closing from the three lines flat, and it is expected that the possibility of forming a unilateral trend is not great. Focus on the gains and losses of the middle track 3295. If the middle track is lost, it may fall further to the lower track near 3200. If the middle track is supported, the breakthrough of the moving average needs to be paid attention to. The 5-day moving average is at 3340, and the 10-day moving average is at 3328. Only when it re-stands on the 5-day moving average will the market strengthen and rise again.
Today, Monday, the Asian morning session continued the decline at the end of last Friday and fell and rebounded, reaching the low of 3293. Then the market stabilized and strengthened. The European session continued to break highs but the continuity was insufficient, reaching the highest of 3328, which just hit the 10-day moving average of the daily line, which was also the 0.382 golden section position of last Friday. It is temporarily regarded as a weak rebound correction. On the whole, the short-term trend of gold is dominated by bears, and the rebound is just a correction to the decline on Friday. The operation strategy recommends shorting on rebounds as the main, and long on declines to lows as the auxiliary. Pay attention to the short-term resistance of 3328 and 3335 on the top, and the short-term support of 3307 and 3295 on the bottom.
Related publications
Disclaimer
The information and publications are not meant to be, and do not constitute, financial, investment, trading, or other types of advice or recommendations supplied or endorsed by TradingView. Read more in the Terms of Use.
Related publications
Disclaimer
The information and publications are not meant to be, and do not constitute, financial, investment, trading, or other types of advice or recommendations supplied or endorsed by TradingView. Read more in the Terms of Use.