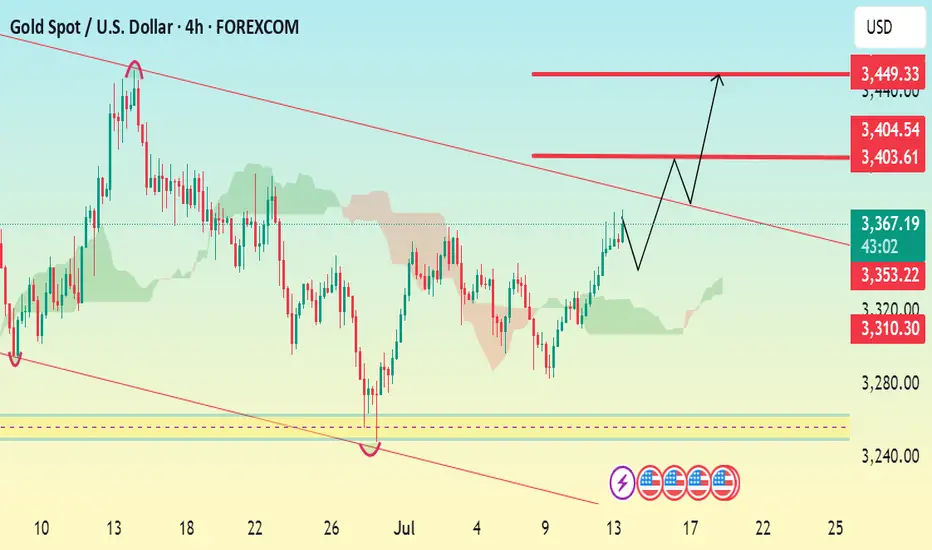
Current Price: ~$3,371
Trend: Currently breaking out of a downtrend channel, with a strong upward push.
Chart Pattern: Price has formed a rounded bottom and is moving higher, indicating bullish momentum
🔼 Resistance Levels (Targets):
1. First Resistance / Target: ~3,404.54 – 3,403.61
→ This is the first breakout target after crossing the trendline.
2. Final Resistance / Target: ~3,462.40 – 3,490.39
→ This zone represents the major resistance where bulls might face selling pressure.
🔽 Support Level:
Support Zone: ~3,310 – 3,320
→ This is the previous bottom and the bullish reversal zone, acting as strong support.
📈 Projected Bullish Move (According to Chart Arrows):
A pullback may occur after breaking above the trendline.
Then, price is expected to rally toward 3,403, retest, and eventually target 3,462 – 3,490 area.
✅ Key Indicators Noted:
The Ichimoku cloud shows bullish bias.
Chart shows higher lows, indicating strengthening buyer interest.
Bullish candle formations near the breakout zone support upward continuation.
🧭 Conclusion (Trade Idea):
Bias: Bullish
Entry: On breakout and retest above the trendline (around 3,360–3,370)
Targets:
1st Target: 3,404
2nd Target: 3,462
Final Target: 3,490
Stop Loss: Below 3,320 support zone
📲 Join telegram channel free ..
t.me/docter_Pips_official05
Forex, Gold & Crypto Signals with detailed analysis & get consistent results..
t.me/docter_Pips_official05
Gold Signal's with proper TP & SL for high profit.
t.me/docter_Pips_official05
Forex, Gold & Crypto Signals with detailed analysis & get consistent results..
t.me/docter_Pips_official05
Gold Signal's with proper TP & SL for high profit.
Disclaimer
The information and publications are not meant to be, and do not constitute, financial, investment, trading, or other types of advice or recommendations supplied or endorsed by TradingView. Read more in the Terms of Use.